Advertisement
- United States
- /
- Consumer Services
- /
- NYSE:MH
McGraw Hill (MH): Examining Valuation After Recent Share Price Slide

Simply Wall St
Reviewed by Kshitija Bhandaru
McGraw Hill (MH) shares have seen a steady slide over the past month, slipping nearly 18%. While no headline event spurred the moves, investors are watching for fundamental shifts in revenue and growth prospects.
See our latest analysis for McGraw Hill.
This latest dip puts McGraw Hill’s share price return at negative 0.18% for the past month and negative 0.31% year to date. This suggests momentum has faded lately, even as some investors look for signs of a turnaround or deeper value.
If you’re looking for ideas beyond McGraw Hill, this could be an ideal time to expand your search and discover fast growing stocks with high insider ownership
The recent slide raises a key question: is McGraw Hill now trading below its true worth, or is the market already factoring in any potential resurgence? Does this pullback present a genuine buying opportunity, or is growth fully priced in?
Price-to-Sales of 1.1x: Is it justified?
McGraw Hill is trading at a price-to-sales ratio of 1.1x, putting its shares at a noticeable discount compared to both its peer group and the broader industry averages.
The price-to-sales ratio represents how much investors are willing to pay per dollar of revenue. In sectors where profits may fluctuate or be negative, this ratio is often an important lens for comparing company value, especially for firms still working toward sustained profitability.
For McGraw Hill, this current valuation stands out as not only below the peer average of 2.1x but also cheaper than the US Consumer Services industry average of 1.6x. This signals that the market could be undervaluing the company’s revenue relative to comparable businesses, potentially overlooking some turnaround potential or growth prospects on the horizon.
See what the numbers say about this price — find out in our valuation breakdown.
Result: Price-to-Sales of 1.1x (UNDERVALUED)
However, McGraw Hill’s negative net income and modest revenue growth may limit rerating potential if market sentiment remains cautious on turnaround stories.
Find out about the key risks to this McGraw Hill narrative.
Another View: Our DCF Model Puts It in Perspective
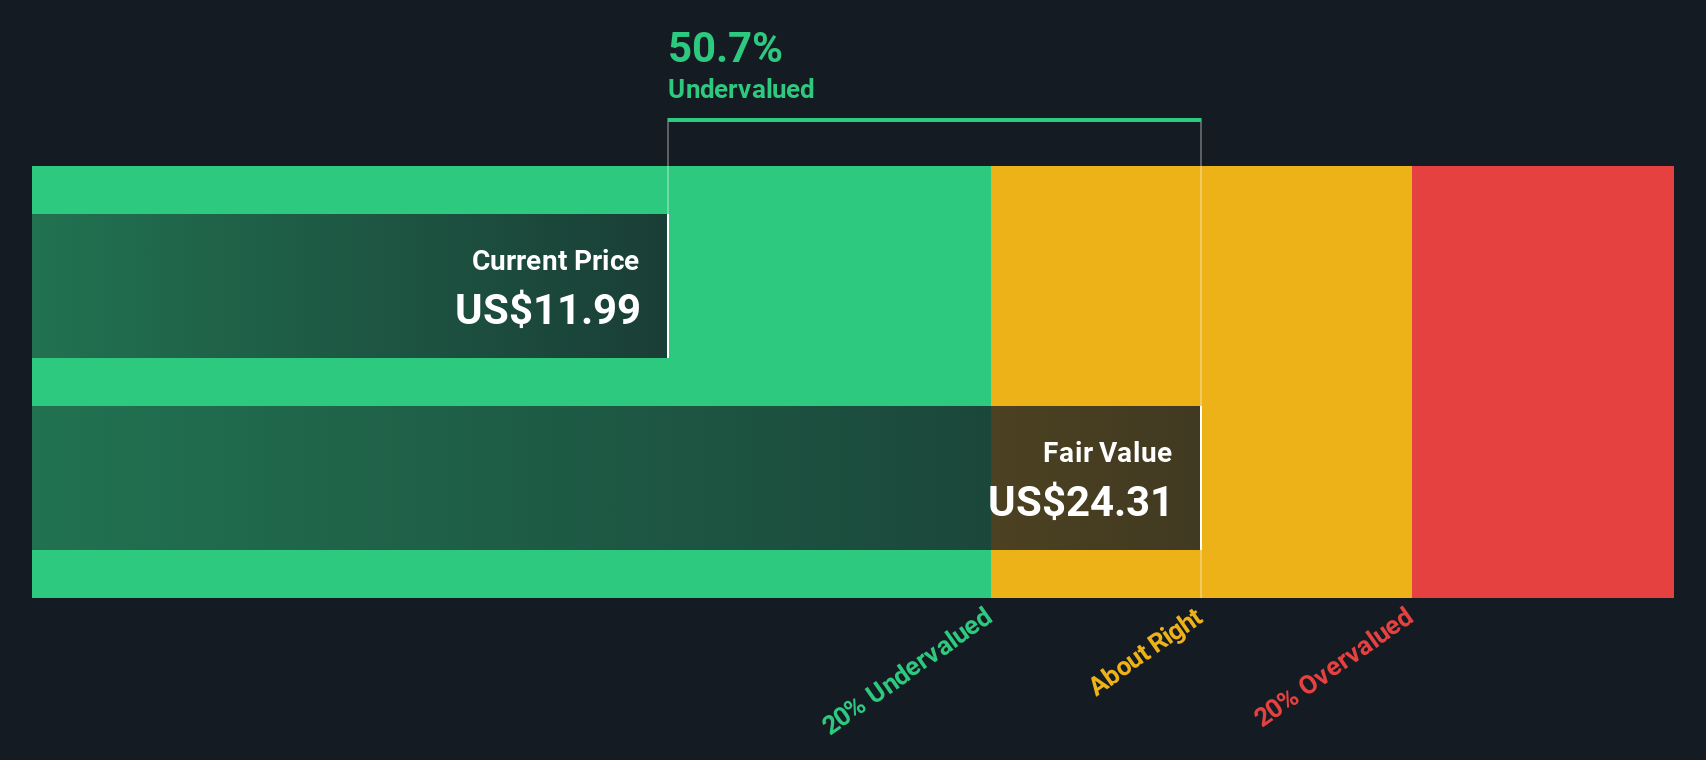
Looking at McGraw Hill through the lens of our DCF model tells a similar undervaluation story. The SWS DCF model estimates a fair value of $24.65, while shares trade at just $11.70. This puts the stock approximately 52.5% below this calculation. But does this alternative method validate the value, or is there a catch in the assumptions underneath?
Look into how the SWS DCF model arrives at its fair value.
Simply Wall St performs a discounted cash flow (DCF) on every stock in the world every day (check out McGraw Hill for example). We show the entire calculation in full. You can track the result in your watchlist or portfolio and be alerted when this changes, or use our stock screener to discover undervalued stocks based on their cash flows. If you save a screener we even alert you when new companies match - so you never miss a potential opportunity.
Build Your Own McGraw Hill Narrative
If you want to reach your own conclusions or would rather dig into the numbers yourself, it’s quick and simple to shape your own view in minutes. Do it your way
A good starting point is our analysis highlighting 2 key rewards investors are optimistic about regarding McGraw Hill.
Looking for More Investment Opportunities?
Why limit yourself to just one stock when unique returns could be waiting elsewhere? Take charge and see what else could boost your portfolio’s performance.
- Grab the chance to spot undervalued gems by checking out these 916 undervalued stocks based on cash flows with strong cash flow potential that the rest of the market may be missing.
- Start building passive income and see which companies are offering yields over 3% by reviewing these 19 dividend stocks with yields > 3%.
- Capitalize on the AI revolution and find tomorrow’s innovators with these 23 AI penny stocks leading cutting-edge breakthroughs.
This article by Simply Wall St is general in nature. We provide commentary based on historical data and analyst forecasts only using an unbiased methodology and our articles are not intended to be financial advice. It does not constitute a recommendation to buy or sell any stock, and does not take account of your objectives, or your financial situation. We aim to bring you long-term focused analysis driven by fundamental data. Note that our analysis may not factor in the latest price-sensitive company announcements or qualitative material. Simply Wall St has no position in any stocks mentioned.
New: Manage All Your Stock Portfolios in One Place
We've created the ultimate portfolio companion for stock investors, and it's free.
• Connect an unlimited number of Portfolios and see your total in one currency
• Be alerted to new Warning Signs or Risks via email or mobile
• Track the Fair Value of your stocks
Have feedback on this article? Concerned about the content? Get in touch with us directly. Alternatively, email editorial-team@simplywallst.com
About NYSE:MH
McGraw Hill
McGraw Hill, Inc., doing business as McGraw Hill, provides information solutions for K-12, higher education, and professional markets in the United States and internationally.
Good value with reasonable growth potential.
Similar Companies
Market Insights

Advertisement
Community Narratives
The Next Phase of Energy Storage: How NeoVolta Is Tackling America’s Power Crunch
Fair Value US$7.50|35.2% undervalued
MA
Community Contributor
Why EnSilica is Worth Possibly 13x its Current Price
Fair Value UK£5.00|90.0% undervalued
DO
Community Contributor
M&A Activity, Industry Diversification & A Defense Contract Monopoly Will Push BWXT For Healthy Long-Term Growth
Fair Value US$220.00|15.6% undervalued
CL
Community Contributor
A case for Cassiar Gold Corp (TSXV: GLDC) to reach CAD$8-10 before 2030 (X30-37)
Fair Value CA$10.00|97.1% undervalued
AG
Community Contributor