
Advertisement
- United States
- /
- Consumer Services
- /
- NYSE:CHGG
Chegg, Inc. (NYSE:CHGG) Looks Inexpensive After Falling 38% But Perhaps Not Attractive Enough
Unfortunately for some shareholders, the Chegg, Inc. (NYSE:CHGG) share price has dived 38% in the last thirty days, prolonging recent pain. The recent drop completes a disastrous twelve months for shareholders, who are sitting on a 72% loss during that time.
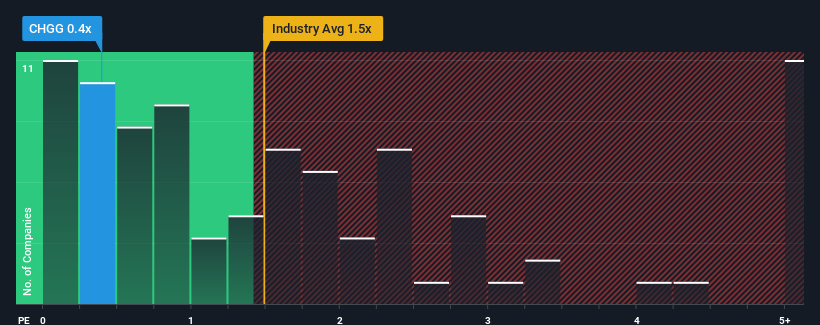
Although its price has dipped substantially, given about half the companies operating in the United States' Consumer Services industry have price-to-sales ratios (or "P/S") above 1.5x, you may still consider Chegg as an attractive investment with its 0.4x P/S ratio. However, the P/S might be low for a reason and it requires further investigation to determine if it's justified.
See our latest analysis for Chegg
What Does Chegg's P/S Mean For Shareholders?
While the industry has experienced revenue growth lately, Chegg's revenue has gone into reverse gear, which is not great. It seems that many are expecting the poor revenue performance to persist, which has repressed the P/S ratio. If you still like the company, you'd be hoping this isn't the case so that you could potentially pick up some stock while it's out of favour.
Keen to find out how analysts think Chegg's future stacks up against the industry? In that case, our free report is a great place to start.How Is Chegg's Revenue Growth Trending?
Chegg's P/S ratio would be typical for a company that's only expected to deliver limited growth, and importantly, perform worse than the industry.
In reviewing the last year of financials, we were disheartened to see the company's revenues fell to the tune of 6.5%. This means it has also seen a slide in revenue over the longer-term as revenue is down 1.1% in total over the last three years. Therefore, it's fair to say the revenue growth recently has been undesirable for the company.
Looking ahead now, revenue is anticipated to slump, contracting by 7.4% during the coming year according to the analysts following the company. That's not great when the rest of the industry is expected to grow by 15%.
With this in consideration, we find it intriguing that Chegg's P/S is closely matching its industry peers. Nonetheless, there's no guarantee the P/S has reached a floor yet with revenue going in reverse. Even just maintaining these prices could be difficult to achieve as the weak outlook is weighing down the shares.
The Bottom Line On Chegg's P/S
The southerly movements of Chegg's shares means its P/S is now sitting at a pretty low level. Using the price-to-sales ratio alone to determine if you should sell your stock isn't sensible, however it can be a practical guide to the company's future prospects.
As we suspected, our examination of Chegg's analyst forecasts revealed that its outlook for shrinking revenue is contributing to its low P/S. As other companies in the industry are forecasting revenue growth, Chegg's poor outlook justifies its low P/S ratio. Unless these conditions improve, they will continue to form a barrier for the share price around these levels.
You should always think about risks. Case in point, we've spotted 4 warning signs for Chegg you should be aware of, and 1 of them is a bit unpleasant.
It's important to make sure you look for a great company, not just the first idea you come across. So if growing profitability aligns with your idea of a great company, take a peek at this free list of interesting companies with strong recent earnings growth (and a low P/E).
New: AI Stock Screener & Alerts
Our new AI Stock Screener scans the market every day to uncover opportunities.
• Dividend Powerhouses (3%+ Yield)
• Undervalued Small Caps with Insider Buying
• High growth Tech and AI Companies
Or build your own from over 50 metrics.
Have feedback on this article? Concerned about the content? Get in touch with us directly. Alternatively, email editorial-team (at) simplywallst.com.
This article by Simply Wall St is general in nature. We provide commentary based on historical data and analyst forecasts only using an unbiased methodology and our articles are not intended to be financial advice. It does not constitute a recommendation to buy or sell any stock, and does not take account of your objectives, or your financial situation. We aim to bring you long-term focused analysis driven by fundamental data. Note that our analysis may not factor in the latest price-sensitive company announcements or qualitative material. Simply Wall St has no position in any stocks mentioned.
Have feedback on this article? Concerned about the content? Get in touch with us directly. Alternatively, email editorial-team@simplywallst.com
About NYSE:CHGG
Chegg
Provides individualized learning support to students that helps build essential academic, life, and job skills to achieve success in the United States and internationally.
Excellent balance sheet and good value.
Similar Companies
Market Insights

Advertisement
Community Narratives
MicroVision will explode future revenue by 380.37% with a vision towards success
Fair Value US$60|98.4% undervalued
TH
Community Contributor
The Indispensable Artery for a New North American Economy
Fair Value CA$132.87|0.7% overvalued
TI
Community Contributor
Recently Updated Narratives
PO

PortfolioPlus on Bisalloy Steel Group ·
Bisalloy Steel Group will shine with a projected profit margin increase of 12.8%
Fair Value:AU$6.7118.0% undervalued
2 followersusers have followed this narrative
0 commentsusers have commented on this narrative
0 likesusers have liked this narrative
CO

composite32 on Astor Enerji ·
Astor Enerji will surge with a fair value of $140.43 in the next 3 years
Fair Value:₺140.4335.5% undervalued
1 followerusers have followed this narrative
0 commentsusers have commented on this narrative
0 likesusers have liked this narrative
RE

RecMag on Proximus ·
Proximus: The State-Backed Backup Plan with 7% Gross Yield and 15% Currency Upside.
Fair Value:€17.1356.7% undervalued
31 followersusers have followed this narrative
0 commentsusers have commented on this narrative
0 likesusers have liked this narrative
Popular Narratives
TH

TheWallstreetKing on MicroVision ·
MicroVision will explode future revenue by 380.37% with a vision towards success
Fair Value:US$6098.4% undervalued
101 followersusers have followed this narrative
10 commentsusers have commented on this narrative
20 likesusers have liked this narrative
AN


AnalystConsensusTarget on NVIDIA ·
NVDA: Expanding AI Demand Will Drive Major Data Center Investments Through 2026
Fair Value:US$250.3929.3% undervalued
933 followersusers have followed this narrative
6 commentsusers have commented on this narrative
23 likesusers have liked this narrative
OS


oscargarcia on Alphabet ·
The company that turned a verb into a global necessity and basically runs the modern internet, digital ads, smartphones, maps, and AI.
Fair Value:US$3405.8% undervalued
140 followersusers have followed this narrative
6 commentsusers have commented on this narrative
18 likesusers have liked this narrative