Advertisement
- United States
- /
- Hospitality
- /
- NYSE:BROS
Is Dutch Bros’ Expansion Driving a Fair Share Price After 75% Surge?

Simply Wall St
Reviewed by Bailey Pemberton
- Thinking about whether Dutch Bros is a bargain right now? Let’s break down what’s really happening beneath the surface to see if the stock’s price matches its potential.
- Shares have climbed 10.0% in the last month and are up a striking 74.8% over the past year. This indicates that momentum is clearly on their side.
- Recent buzz around the company’s expansion plans and rapid footprint growth has caught investors’ attention, especially as Dutch Bros opens new locations in additional markets. Several analysts are debating whether this aggressive growth approach can be sustained without sacrificing profitability.
- Despite all the excitement, Dutch Bros only scores a 1 out of 6 on our undervaluation checks. This suggests that caution is still warranted. We’ll examine the most common valuation approaches next, and later, reveal a smarter way to think about the future value of the company.
Dutch Bros scores just 1/6 on our valuation checks. See what other red flags we found in the full valuation breakdown.
Approach 1: Dutch Bros Discounted Cash Flow (DCF) Analysis
The Discounted Cash Flow (DCF) model projects a company’s future free cash flows and then discounts them back to today’s dollars. This process helps estimate what the business is really worth based on its ability to generate cash over time, rather than relying solely on earnings multiples or other comparables.
For Dutch Bros, the DCF is built from their current Free Cash Flow, which stands at negative $5.3 Million. Despite this starting point, analysts predict significant growth, with free cash flow forecasted to rise over the coming years and reach about $344 Million by 2029. These long-term projections are partly informed by analyst estimates for the first five years, while later years are extrapolated by Simply Wall St.
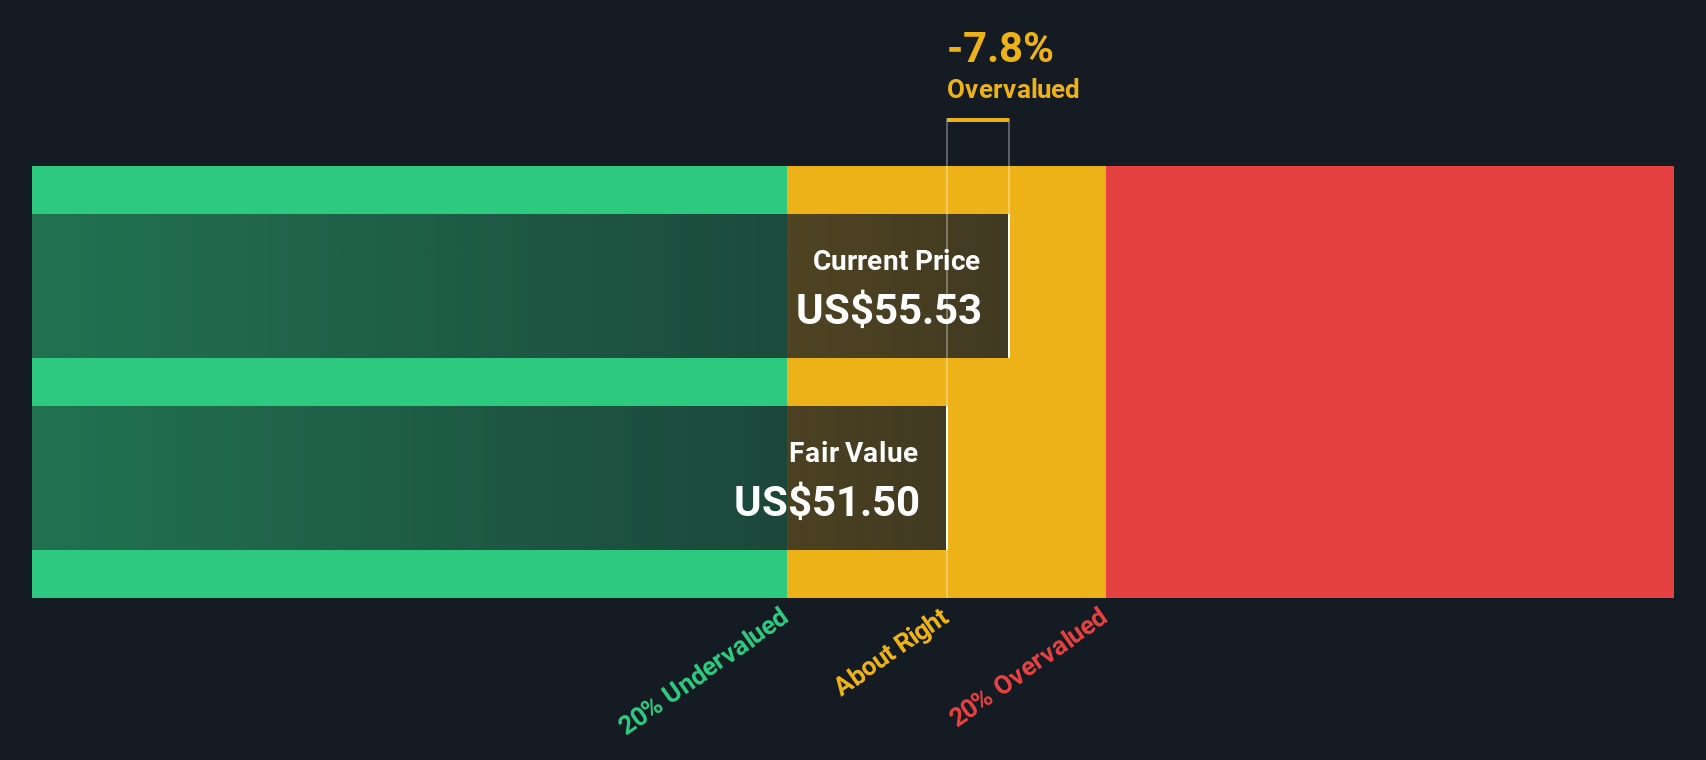
Using these cash flow forecasts, the DCF model estimates an intrinsic value of $51.46 per share. When comparing this to the current market price, the DCF suggests Dutch Bros is currently trading at a 12.4% premium to its fair value. This means the stock is seen as overvalued on this basis.
Result: OVERVALUED
Our Discounted Cash Flow (DCF) analysis suggests Dutch Bros may be overvalued by 12.4%. Discover 848 undervalued stocks or create your own screener to find better value opportunities.
Approach 2: Dutch Bros Price vs Earnings (P/E Ratio)
The Price-to-Earnings (P/E) ratio is often the go-to valuation measure for profitable companies because it connects a company’s stock price with its actual earnings, making it easier to compare apples to apples across different businesses. When a company boasts strong earnings growth or lower risk, investors are generally willing to pay a higher P/E ratio. In contrast, slower growth or higher risk should typically push that ratio down.
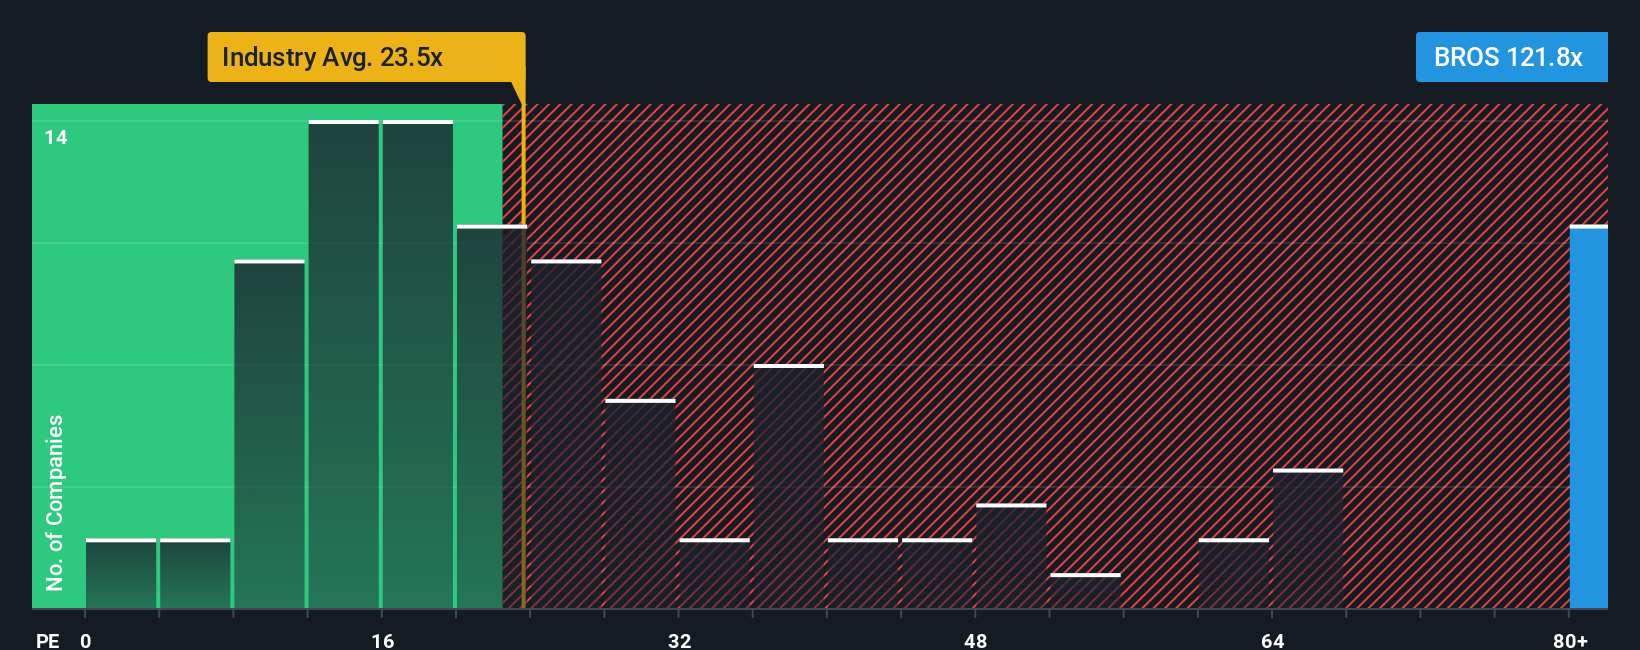
Right now, Dutch Bros is trading at a P/E ratio of 128.3x. For context, the average P/E for its hospitality industry peers is 23.7x, and a group of directly comparable companies averages about 35.9x. These numbers show that Dutch Bros is commanding a much higher valuation compared to its peers and the industry standard.
This is where Simply Wall St’s proprietary “Fair Ratio” comes into play. The Fair Ratio for Dutch Bros is 36.1x, calculated based on factors like its unique growth profile, profit margins, industry standing, and market cap. This offers a more custom fit than simply comparing to broad industry or peer benchmarks. Unlike basic peer or industry averages, the Fair Ratio adjusts for the nuances in Dutch Bros’ outlook and risk, aiming to capture what’s truly “fair” for this specific company at this stage.
Since Dutch Bros’ actual P/E ratio is substantially higher than its Fair Ratio, the stock appears to be significantly overvalued based on this approach.
Result: OVERVALUED
PE ratios tell one story, but what if the real opportunity lies elsewhere? Discover 1382 companies where insiders are betting big on explosive growth.
Upgrade Your Decision Making: Choose your Dutch Bros Narrative
Earlier we mentioned that there is an even better way to understand valuation, so let’s introduce you to Narratives. Narratives are a simple but powerful tool available on Simply Wall St that allow you to connect your personal perspective or story about a company to actual financial forecasts and an estimated fair value, making stock investing more intuitive and actionable.
Think of a Narrative as your own story about Dutch Bros, explaining how you believe the company’s strategies, risks, and market opportunities will play out in the numbers, such as future revenue, profit margins, and ultimately fair value per share. When you create or follow a Narrative in the Community page, you are essentially linking the story you believe in with the forecasted financials, so you can clearly see whether the current price fits your outlook or not.
The beauty of Narratives is how they dynamically update; factors like new earnings releases or major news immediately flow through to refresh the Narrative’s forecasts and fair value. This makes it easy to track whether your investment thesis still stacks up and helps inform your buy or sell decisions.
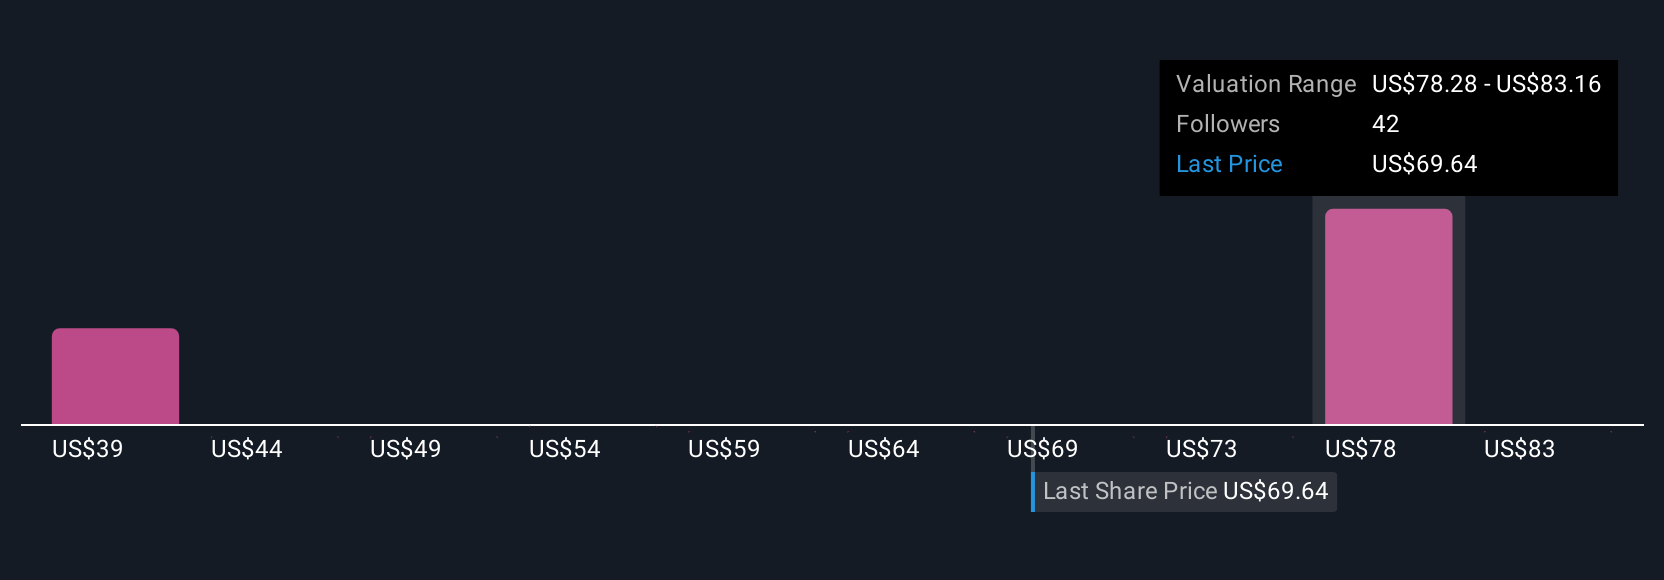
For example, one investor might be optimistic that Dutch Bros’ rapid Sun Belt expansion and tech upgrades will justify a $92 target. Another investor may expect competitive and margin pressures could mean a more conservative $73 value. The right Narrative helps you see which vision matches your expectations and the actual numbers today.
Do you think there's more to the story for Dutch Bros? Head over to our Community to see what others are saying!
This article by Simply Wall St is general in nature. We provide commentary based on historical data and analyst forecasts only using an unbiased methodology and our articles are not intended to be financial advice. It does not constitute a recommendation to buy or sell any stock, and does not take account of your objectives, or your financial situation. We aim to bring you long-term focused analysis driven by fundamental data. Note that our analysis may not factor in the latest price-sensitive company announcements or qualitative material. Simply Wall St has no position in any stocks mentioned.
New: Manage All Your Stock Portfolios in One Place
We've created the ultimate portfolio companion for stock investors, and it's free.
• Connect an unlimited number of Portfolios and see your total in one currency
• Be alerted to new Warning Signs or Risks via email or mobile
• Track the Fair Value of your stocks
Have feedback on this article? Concerned about the content? Get in touch with us directly. Alternatively, email editorial-team@simplywallst.com
About NYSE:BROS
Dutch Bros
Operates and franchises drive-thru shops in the United States.
High growth potential with solid track record.
Similar Companies
Market Insights

Advertisement
Community Narratives
The company that turned a verb into a global necessity and basically runs the modern internet, digital ads, smartphones, maps, and AI.
Fair Value US$300.00|8.5% undervalued
OS
Community Contributor
Flowers Foods Pays A Fair Price For Health
Fair Value US$16.12|24.6% undervalued
NV
Community Contributor
TMX Group will thrive with 33.3% profit margin and enduring market moat
Fair Value CA$49.90|0.1% undervalued
LI
Community Contributor