- United States
- /
- Hospitality
- /
- NasdaqGS:PZZA
Even after rising 4.6% this past week, Papa John's International (NASDAQ:PZZA) shareholders are still down 59% over the past three years


If you love investing in stocks you're bound to buy some losers. But long term Papa John's International, Inc. (NASDAQ:PZZA) shareholders have had a particularly rough ride in the last three year. So they might be feeling emotional about the 61% share price collapse, in that time. And more recent buyers are having a tough time too, with a drop of 34% in the last year.
While the stock has risen 4.6% in the past week but long term shareholders are still in the red, let's see what the fundamentals can tell us.
See our latest analysis for Papa John's International
To quote Buffett, 'Ships will sail around the world but the Flat Earth Society will flourish. There will continue to be wide discrepancies between price and value in the marketplace...' One imperfect but simple way to consider how the market perception of a company has shifted is to compare the change in the earnings per share (EPS) with the share price movement.
During five years of share price growth, Papa John's International moved from a loss to profitability. That would generally be considered a positive, so we are surprised to see the share price is down. So it's worth looking at other metrics to try to understand the share price move.
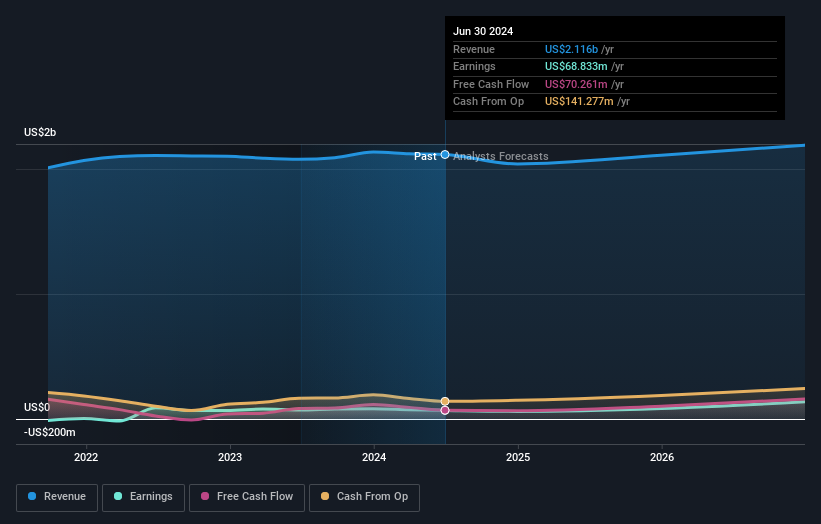
The company has kept revenue pretty healthy over the last three years, so we doubt that explains the falling share price. We're not entirely sure why the share price is dropped, but it does seem likely investors have become less optimistic about the business.
You can see how earnings and revenue have changed over time in the image below (click on the chart to see the exact values).
It's good to see that there was some significant insider buying in the last three months. That's a positive. That said, we think earnings and revenue growth trends are even more important factors to consider. This free report showing analyst forecasts should help you form a view on Papa John's International
What About Dividends?
It is important to consider the total shareholder return, as well as the share price return, for any given stock. Whereas the share price return only reflects the change in the share price, the TSR includes the value of dividends (assuming they were reinvested) and the benefit of any discounted capital raising or spin-off. So for companies that pay a generous dividend, the TSR is often a lot higher than the share price return. In the case of Papa John's International, it has a TSR of -59% for the last 3 years. That exceeds its share price return that we previously mentioned. This is largely a result of its dividend payments!
A Different Perspective
While the broader market gained around 26% in the last year, Papa John's International shareholders lost 32% (even including dividends). Even the share prices of good stocks drop sometimes, but we want to see improvements in the fundamental metrics of a business, before getting too interested. On the bright side, long term shareholders have made money, with a gain of 1.3% per year over half a decade. It could be that the recent sell-off is an opportunity, so it may be worth checking the fundamental data for signs of a long term growth trend. It's always interesting to track share price performance over the longer term. But to understand Papa John's International better, we need to consider many other factors. Take risks, for example - Papa John's International has 2 warning signs (and 1 which is significant) we think you should know about.
Papa John's International is not the only stock that insiders are buying. For those who like to find lesser know companies this free list of growing companies with recent insider purchasing, could be just the ticket.
Please note, the market returns quoted in this article reflect the market weighted average returns of stocks that currently trade on American exchanges.
New: Manage All Your Stock Portfolios in One Place
We've created the ultimate portfolio companion for stock investors, and it's free.
• Connect an unlimited number of Portfolios and see your total in one currency
• Be alerted to new Warning Signs or Risks via email or mobile
• Track the Fair Value of your stocks
Have feedback on this article? Concerned about the content? Get in touch with us directly. Alternatively, email editorial-team (at) simplywallst.com.
This article by Simply Wall St is general in nature. We provide commentary based on historical data and analyst forecasts only using an unbiased methodology and our articles are not intended to be financial advice. It does not constitute a recommendation to buy or sell any stock, and does not take account of your objectives, or your financial situation. We aim to bring you long-term focused analysis driven by fundamental data. Note that our analysis may not factor in the latest price-sensitive company announcements or qualitative material. Simply Wall St has no position in any stocks mentioned.
About NasdaqGS:PZZA
Papa John's International
Operates and franchises pizza delivery and carryout restaurants under the Papa John's trademark in the United States and internationally.
Established dividend payer and good value.

