Advertisement
- United States
- /
- Hospitality
- /
- NasdaqGS:PZZA
Assessing Papa John's After a 21% Share Price Drop and Shifting Consumer Trends

Simply Wall St
Reviewed by Bailey Pemberton
- Curious if Papa John's International stock is a value opportunity or a value trap? Let's dig into what the numbers and recent activity suggest for would-be investors.
- The share price has seen some turbulence lately, dropping 21.3% in the last week and 11.4% over the last month. This might hint at shifting market sentiment or new risks emerging.
- Growing concerns about shifting consumer trends and competitive pressures have weighed on the stock recently, drawing extra attention from both bulls and bears. Updates on store growth strategies and leadership changes have also played into the story and stirred questions about the company's next move.
- Right now, Papa John's scores a 2/6 on our valuation checks. This reflects that it's considered undervalued in only two areas. We'll look closely at what each valuation approach uncovers and keep an eye out for an even smarter perspective on value later in the article.
Papa John's International scores just 2/6 on our valuation checks. See what other red flags we found in the full valuation breakdown.
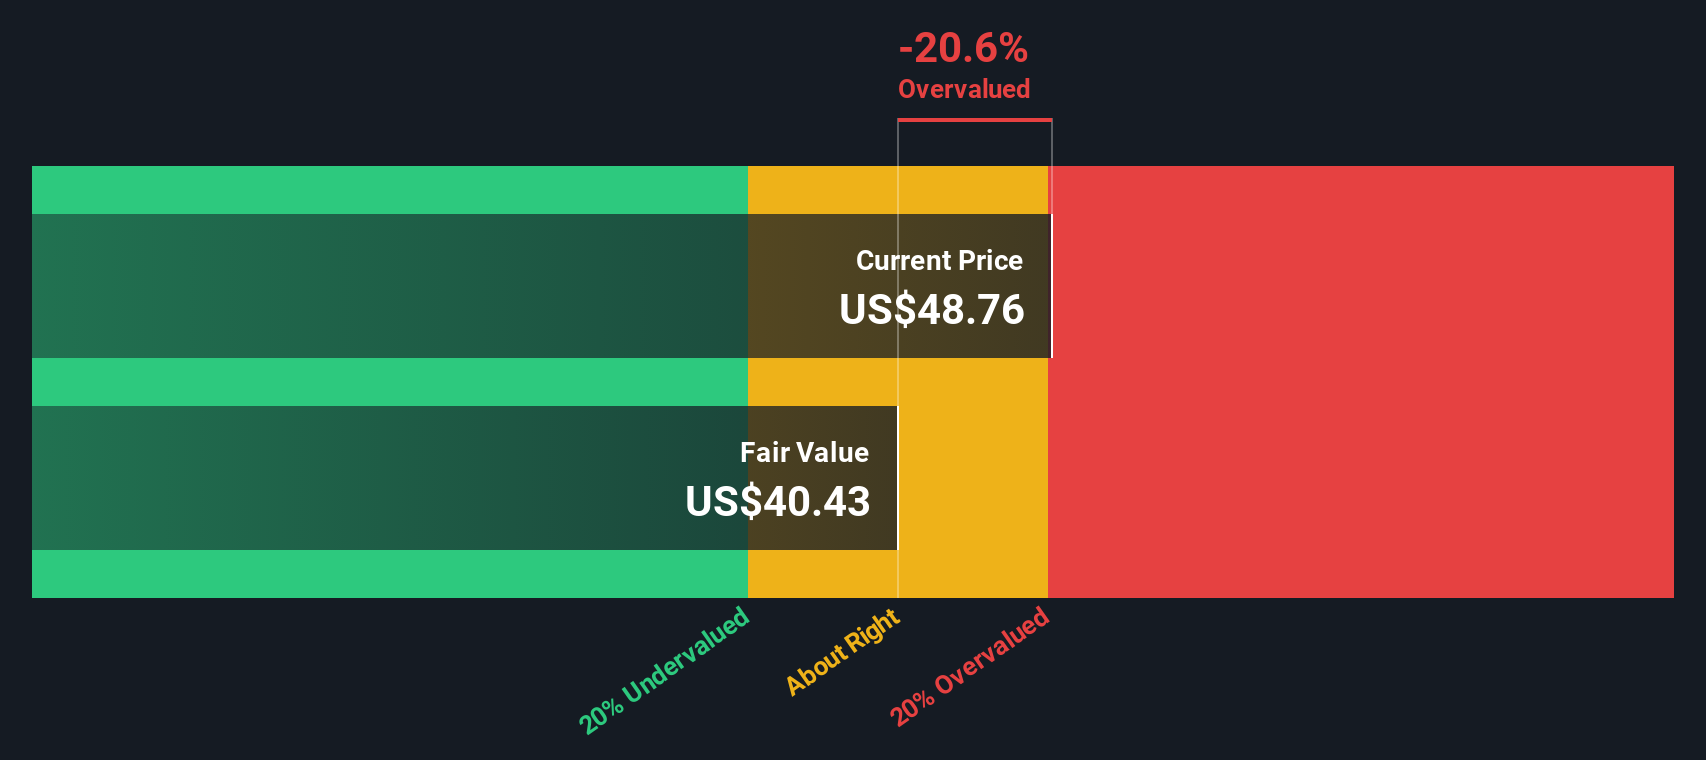
Approach 1: Papa John's International Discounted Cash Flow (DCF) Analysis
A Discounted Cash Flow (DCF) model estimates a company's value by projecting its future cash flows and discounting them back to today's value. This helps investors determine what the company might truly be worth right now, based on how much cash it is expected to generate.
For Papa John's International, the model starts with the latest reported Free Cash Flow, which stands at $55.7 million. Analysts forecast this figure will grow over the next several years, reaching approximately $86.9 million in 2026. Looking further out, longer-term projections as extrapolated by Simply Wall St expect Free Cash Flow could increase to around $144.8 million by 2035.
After running these projections through the DCF model, the estimated intrinsic value of Papa John's International lands at $47.32 per share. Compared to the current market price, this suggests the stock is trading at a 12.8% discount to its underlying value, which implies it may be undervalued based on projected future cash flows.
Result: UNDERVALUED
Our Discounted Cash Flow (DCF) analysis suggests Papa John's International is undervalued by 12.8%. Track this in your watchlist or portfolio, or discover 845 more undervalued stocks based on cash flows.
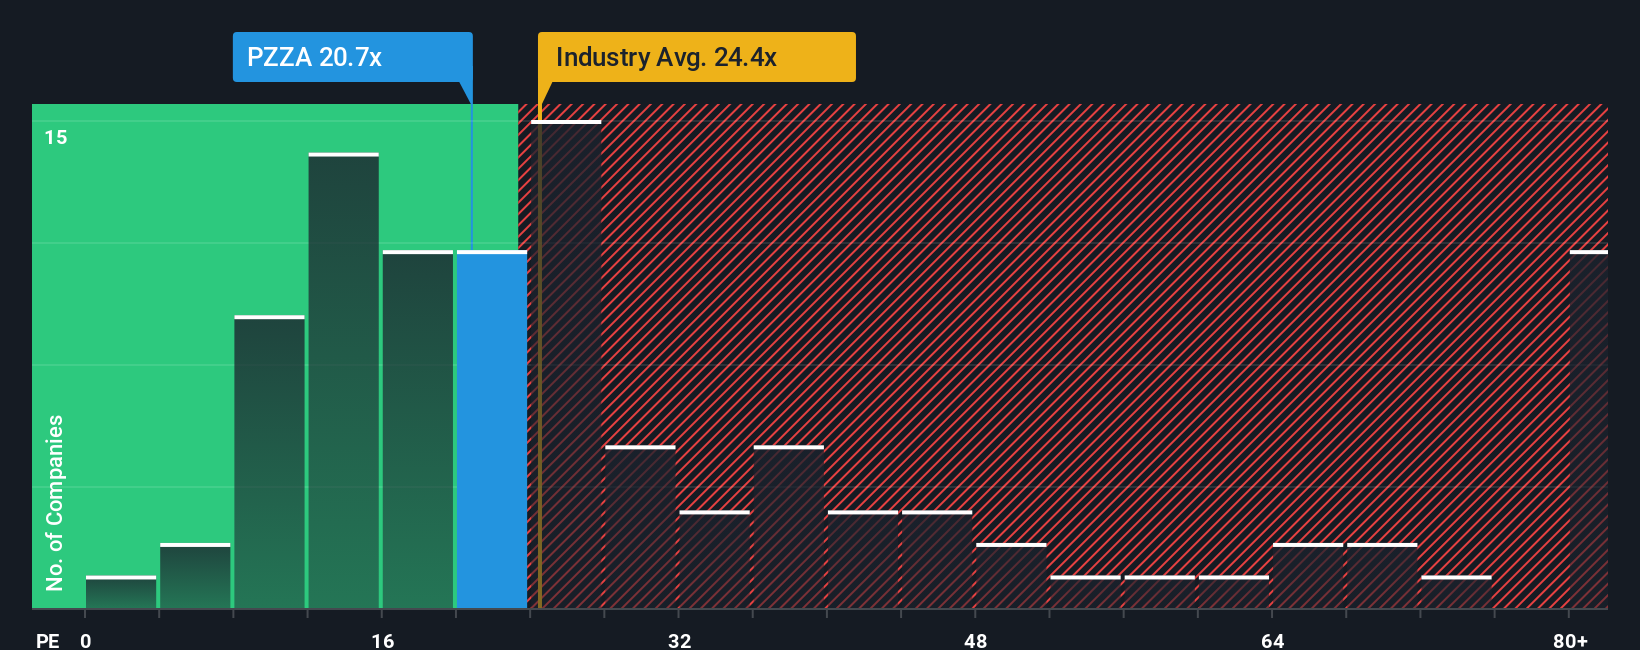
Approach 2: Papa John's International Price vs Earnings
For profitable companies like Papa John's International, the Price-to-Earnings (PE) ratio is a widely used valuation metric because it shows how much investors are willing to pay for each dollar of current earnings. This ratio helps put a company's valuation in context with its profitability, making it especially useful for established businesses with a consistent track record of generating earnings.
Growth expectations and perceived risks influence what a "normal" or "fair" PE ratio should be. Typically, higher growth prospects or lower risk justify a higher PE multiple. If investors believe a company will grow faster than its peers or the broader market, they may pay a premium for that future potential. On the other hand, slower-growing or riskier businesses tend to trade at a discount.
Papa John's International currently trades at a PE ratio of 18.08x. For comparison, the industry average is 23.65x, and peers sit at 15.89x. Simply Wall St introduces a proprietary "Fair Ratio" in this case, 14.97x, which goes beyond simple peer comparison by factoring in the company’s earnings growth outlook, profit margins, possible risks, and its specific position in the market. This makes the Fair Ratio a more tailored benchmark for valuation assessment.
With Papa John's trading at an 18.08x PE compared to its Fair Ratio of 14.97x, the stock appears somewhat expensive on this basis. The difference suggests investors may be paying a premium relative to what is considered fair for its profile.
Result: OVERVALUED
PE ratios tell one story, but what if the real opportunity lies elsewhere? Discover 1405 companies where insiders are betting big on explosive growth.
Upgrade Your Decision Making: Choose your Papa John's International Narrative
Earlier we mentioned that there's an even better way to understand valuation, so let's introduce you to Narratives. Rather than just relying on numbers and standard models, a Narrative invites you to articulate your unique view of Papa John's International. This means forming a story about the company’s future, including your assumptions about revenue, earnings, and profit margins, then seeing how those beliefs translate into a fair value estimate.
A Narrative connects the dots by combining your outlook on Papa John’s strategy, market opportunities, and risks with a financial forecast, resulting in a personalized fair value. Narratives are easy to create and share using Simply Wall St’s Community page, where millions of investors refine their thinking together. This tool empowers you to track your own perspective, compare it directly to the market price, and know exactly when your Narrative says a stock is cheap or expensive.
What’s more, Narratives automatically update when key news or earnings are announced, so your fair value remains relevant as circumstances change. For example, some investors currently project a fair value as high as $67.00, expressing optimism about international expansion, while others take a more cautious view with a target closer to $42.00, focusing on slower growth and margin pressures. Narratives allow you to invest based on your own convictions and react confidently as new information emerges.
Do you think there's more to the story for Papa John's International? Head over to our Community to see what others are saying!

This article by Simply Wall St is general in nature. We provide commentary based on historical data and analyst forecasts only using an unbiased methodology and our articles are not intended to be financial advice. It does not constitute a recommendation to buy or sell any stock, and does not take account of your objectives, or your financial situation. We aim to bring you long-term focused analysis driven by fundamental data. Note that our analysis may not factor in the latest price-sensitive company announcements or qualitative material. Simply Wall St has no position in any stocks mentioned.
New: Manage All Your Stock Portfolios in One Place
We've created the ultimate portfolio companion for stock investors, and it's free.
• Connect an unlimited number of Portfolios and see your total in one currency
• Be alerted to new Warning Signs or Risks via email or mobile
• Track the Fair Value of your stocks
Have feedback on this article? Concerned about the content? Get in touch with us directly. Alternatively, email editorial-team@simplywallst.com
About NasdaqGS:PZZA
Papa John's International
Operates and franchises pizza delivery and carryout restaurants under the Papa Johns trademark in the United States, Canada, and internationally.
Established dividend payer with slight risk.
Similar Companies
Market Insights

Advertisement
Community Narratives
MINISO's fair value is projected at 26.69 with an anticipated PE ratio shift of 20x
Fair Value US$24.03|11.4% undervalued
BE
Community Contributor
Procter & Gamble: A Dividend Giant Facing Slowing Growth
Fair Value US$119.81|23.5% overvalued
AN
Community Contributor
Eli Lilly's Future Growth Driven by Tirzepatide and Favorable Market Conditions
Fair Value US$1.19k|14.0% undervalued
EA
Community Contributor