- United States
- /
- Food and Staples Retail
- /
- NYSE:TGT
Has Target’s Recent Share Rebound Already Priced In Its Recovery Prospects for 2025?

Reviewed by Bailey Pemberton
- If you are wondering whether Target is a bargain or a value trap at today’s price, you are not alone. This breakdown is designed to help you decide with confidence.
- After a tough stretch that still has the stock down 28.1% year to date and 21.2% over the last year, the shares have recently bounced, gaining 4.2% in the last week and 11.4% over the past month.
- That rebound has come as investors digest a stream of updates around consumer spending resilience, shifting retail competition, and Target’s ongoing push to refine its product mix and in store experience. Together, these developments have nudged sentiment off the lows, but they also raise fresh questions about how much of a turnaround is already priced in.
- Right now, Target scores a solid 5 out of 6 on our valuation checks. This suggests it screens as undervalued on most measures. Next we will unpack those methods, before finishing with a more powerful way to think about what the stock is really worth.
Find out why Target's -21.2% return over the last year is lagging behind its peers.
Approach 1: Target Discounted Cash Flow (DCF) Analysis
A Discounted Cash Flow model estimates what a business is worth by projecting the cash it can generate in the future and discounting those dollars back to today’s value. For Target, the model starts with last twelve month Free Cash Flow of about $2.9 Billion and then uses analyst forecasts for the next few years, with Simply Wall St extrapolating further out to fill a 10 year view.
On this basis, Target’s Free Cash Flow is projected to reach roughly $2.8 Billion by 2030, with intermediate years fluctuating but generally increasing over time. These cash flows, all measured in $, are discounted using a 2 Stage Free Cash Flow to Equity model, which separately values the near term forecast period and the longer term steady state.
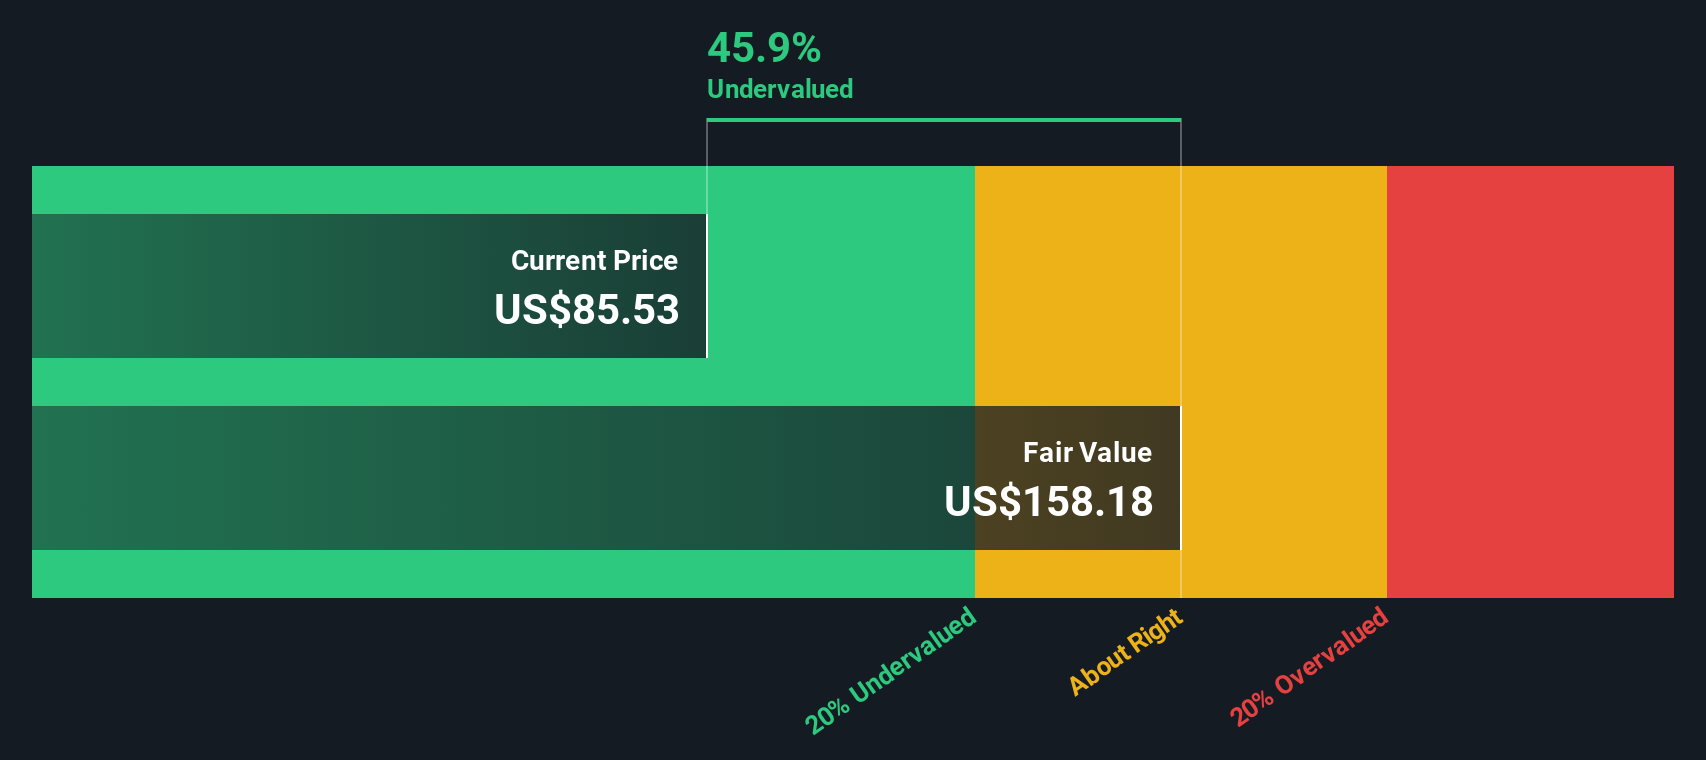
The result is an estimated intrinsic value of about $136.47 per share. Compared with the current share price, this implies the stock is around 27.7% below that estimate, indicating a gap between the market price and this DCF-based valuation of Target’s future cash generation.
Result: UNDERVALUED
Our Discounted Cash Flow (DCF) analysis suggests Target is undervalued by 27.7%. Track this in your watchlist or portfolio, or discover 911 more undervalued stocks based on cash flows.
Approach 2: Target Price vs Earnings
For a mature, consistently profitable retailer like Target, the Price to Earnings ratio is a practical way to judge value because it directly links what investors pay for each share to the profits the business generates today.
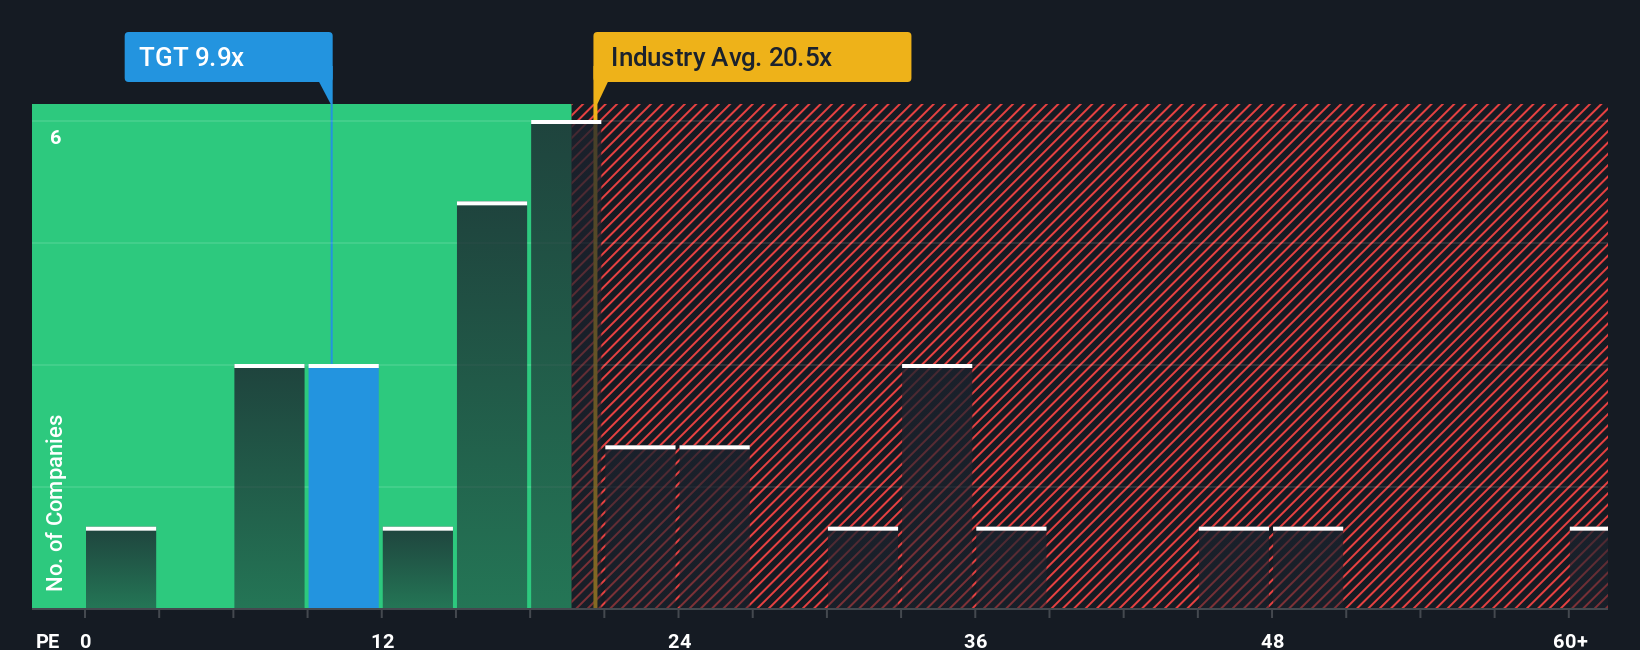
In general, faster growing and lower risk companies deserve a higher, or more generous, PE multiple, while slower growing or riskier businesses tend to trade on lower, more cautious multiples. Target currently trades at about 11.9x earnings, which is well below both the Consumer Retailing industry average of around 21.9x and the broader peer group average of roughly 28.6x.
Simply Wall St’s Fair Ratio for Target is 19.5x, a proprietary estimate of what its PE should be once you factor in earnings growth prospects, profitability, industry positioning, company size, and risk profile. This tailored yardstick is more informative than simple peer or industry comparisons because it adjusts for Target’s specific fundamentals rather than assuming all retailers deserve the same multiple. With the shares at 11.9x versus a Fair Ratio of 19.5x, the stock screens as undervalued on this earnings based lens.
Result: UNDERVALUED
PE ratios tell one story, but what if the real opportunity lies elsewhere? Discover 1463 companies where insiders are betting big on explosive growth.
Upgrade Your Decision Making: Choose your Target Narrative
Earlier we mentioned that there is an even better way to understand valuation. Let us introduce you to Narratives, a simple framework on Simply Wall St’s Community page where you connect your view of a company’s story with a clear financial forecast and a resulting fair value. You can then compare that fair value to today’s price to decide whether to buy, hold, or sell. Each Narrative updates automatically as new news or earnings arrive so your thesis stays current. For example, one investor might build a cautious Target Narrative using slower revenue growth, thinner margins, and a fair value closer to the lower end of analyst expectations. Another might instead emphasize Target’s reinvestment, omnichannel progress, and owned brands to justify stronger growth, healthier margins, and a fair value near the upper end. This shows how different but well structured stories can lead to different, yet transparent, valuation outcomes.
Do you think there's more to the story for Target? Head over to our Community to see what others are saying!

This article by Simply Wall St is general in nature. We provide commentary based on historical data and analyst forecasts only using an unbiased methodology and our articles are not intended to be financial advice. It does not constitute a recommendation to buy or sell any stock, and does not take account of your objectives, or your financial situation. We aim to bring you long-term focused analysis driven by fundamental data. Note that our analysis may not factor in the latest price-sensitive company announcements or qualitative material. Simply Wall St has no position in any stocks mentioned.
The New Payments ETF Is Live on NASDAQ:
Money is moving to real-time rails, and a newly listed ETF now gives investors direct exposure. Fast settlement. Institutional custody. Simple access.
Explore how this launch could reshape portfolios
Sponsored ContentValuation is complex, but we're here to simplify it.
Discover if Target might be undervalued or overvalued with our detailed analysis, featuring fair value estimates, potential risks, dividends, insider trades, and its financial condition.
Access Free AnalysisHave feedback on this article? Concerned about the content? Get in touch with us directly. Alternatively, email editorial-team@simplywallst.com
About NYSE:TGT
6 star dividend payer and undervalued.
Similar Companies
Market Insights

Weekly Picks

Early mover in a fast growing industry. Likely to experience share price volatility as they scale


A case for CA$31.80 (undiluted), aka 8,616% upside from CA$0.37 (an 86 bagger!).


Moderation and Stabilisation: HOLD: Fair Price based on a 4-year Cycle is $12.08
Recently Updated Narratives


An amazing opportunity to potentially get a 100 bagger

Amazon: Why the World’s Biggest Platform Still Runs on Invisible Economics

Sunrun Stock: When the Energy Transition Collides With the Cost of Capital
Popular Narratives


MicroVision will explode future revenue by 380.37% with a vision towards success


Crazy Undervalued 42 Baggers Silver Play (Active & Running Mine)

