- United States
- /
- Food and Staples Retail
- /
- NYSE:PFGC
Those who invested in Performance Food Group (NYSE:PFGC) three years ago are up 140%


The most you can lose on any stock (assuming you don't use leverage) is 100% of your money. But in contrast you can make much more than 100% if the company does well. For instance the Performance Food Group Company (NYSE:PFGC) share price is 140% higher than it was three years ago. Most would be happy with that. In the last week shares have slid back 2.6%.
Let's take a look at the underlying fundamentals over the longer term, and see if they've been consistent with shareholders returns.
Check out our latest analysis for Performance Food Group
SWOT Analysis for Performance Food Group
- Earnings growth over the past year exceeded the industry.
- Debt is well covered by earnings.
- No major weaknesses identified for PFGC.
- Annual earnings are forecast to grow faster than the American market.
- Good value based on P/E ratio and estimated fair value.
- Debt is not well covered by operating cash flow.
- Annual revenue is forecast to grow slower than the American market.
In his essay The Superinvestors of Graham-and-Doddsville Warren Buffett described how share prices do not always rationally reflect the value of a business. One imperfect but simple way to consider how the market perception of a company has shifted is to compare the change in the earnings per share (EPS) with the share price movement.
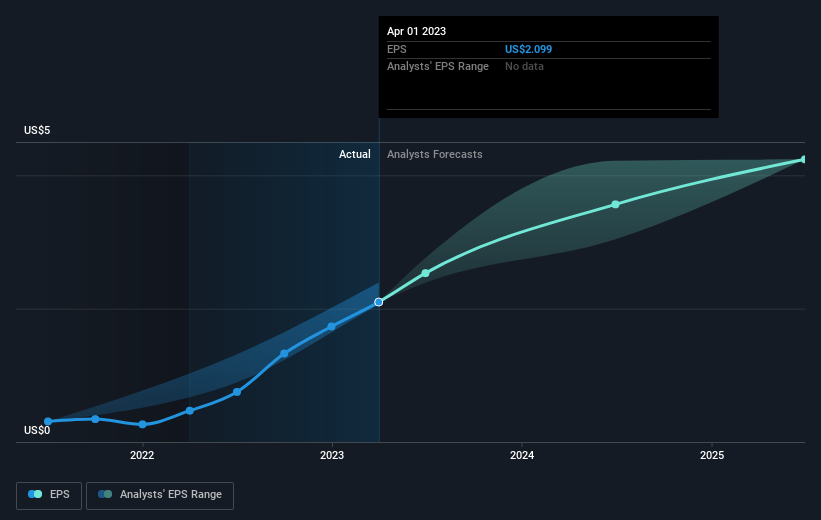
During three years of share price growth, Performance Food Group achieved compound earnings per share growth of 30% per year. We don't think it is entirely coincidental that the EPS growth is reasonably close to the 34% average annual increase in the share price. That suggests that the market sentiment around the company hasn't changed much over that time. Au contraire, the share price change has arguably mimicked the EPS growth.
You can see how EPS has changed over time in the image below (click on the chart to see the exact values).
We know that Performance Food Group has improved its bottom line over the last three years, but what does the future have in store? If you are thinking of buying or selling Performance Food Group stock, you should check out this FREE detailed report on its balance sheet.
A Different Perspective
We're pleased to report that Performance Food Group shareholders have received a total shareholder return of 35% over one year. Since the one-year TSR is better than the five-year TSR (the latter coming in at 11% per year), it would seem that the stock's performance has improved in recent times. In the best case scenario, this may hint at some real business momentum, implying that now could be a great time to delve deeper. While it is well worth considering the different impacts that market conditions can have on the share price, there are other factors that are even more important. Case in point: We've spotted 1 warning sign for Performance Food Group you should be aware of.
Of course Performance Food Group may not be the best stock to buy. So you may wish to see this free collection of growth stocks.
Please note, the market returns quoted in this article reflect the market weighted average returns of stocks that currently trade on American exchanges.
If you're looking to trade Performance Food Group, open an account with the lowest-cost platform trusted by professionals, Interactive Brokers.
With clients in over 200 countries and territories, and access to 160 markets, IBKR lets you trade stocks, options, futures, forex, bonds and funds from a single integrated account.
Enjoy no hidden fees, no account minimums, and FX conversion rates as low as 0.03%, far better than what most brokers offer.
Sponsored ContentNew: Manage All Your Stock Portfolios in One Place
We've created the ultimate portfolio companion for stock investors, and it's free.
• Connect an unlimited number of Portfolios and see your total in one currency
• Be alerted to new Warning Signs or Risks via email or mobile
• Track the Fair Value of your stocks
Have feedback on this article? Concerned about the content? Get in touch with us directly. Alternatively, email editorial-team (at) simplywallst.com.
This article by Simply Wall St is general in nature. We provide commentary based on historical data and analyst forecasts only using an unbiased methodology and our articles are not intended to be financial advice. It does not constitute a recommendation to buy or sell any stock, and does not take account of your objectives, or your financial situation. We aim to bring you long-term focused analysis driven by fundamental data. Note that our analysis may not factor in the latest price-sensitive company announcements or qualitative material. Simply Wall St has no position in any stocks mentioned.
About NYSE:PFGC
Performance Food Group
Through its subsidiaries, engages in the marketing and distribution of food and food-related products in North America.
Moderate growth potential and slightly overvalued.
Similar Companies
Market Insights

Community Narratives

