
Advertisement
- United States
- /
- Food and Staples Retail
- /
- NasdaqGS:CART
Maplebear Inc. (NASDAQ:CART) Shares Could Be 44% Below Their Intrinsic Value Estimate
Key Insights
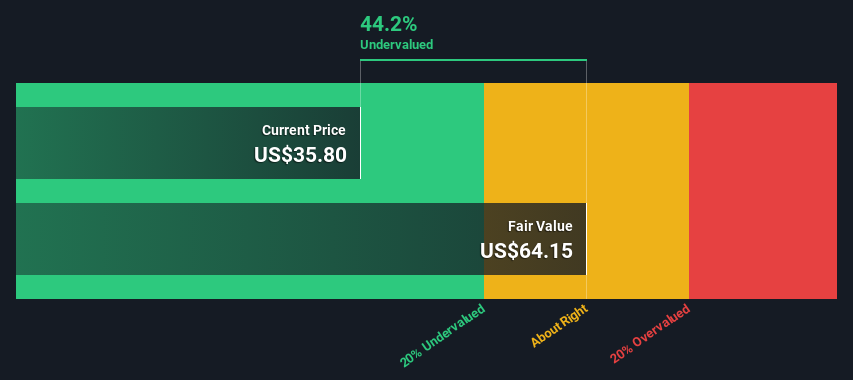
- Using the 2 Stage Free Cash Flow to Equity, Maplebear fair value estimate is US$64.15
- Current share price of US$35.80 suggests Maplebear is potentially 44% undervalued
- The US$35.93 analyst price target for CART is 44% less than our estimate of fair value
Does the March share price for Maplebear Inc. (NASDAQ:CART) reflect what it's really worth? Today, we will estimate the stock's intrinsic value by projecting its future cash flows and then discounting them to today's value. We will take advantage of the Discounted Cash Flow (DCF) model for this purpose. Believe it or not, it's not too difficult to follow, as you'll see from our example!
Remember though, that there are many ways to estimate a company's value, and a DCF is just one method. If you still have some burning questions about this type of valuation, take a look at the Simply Wall St analysis model.
View our latest analysis for Maplebear
What's The Estimated Valuation?
We use what is known as a 2-stage model, which simply means we have two different periods of growth rates for the company's cash flows. Generally the first stage is higher growth, and the second stage is a lower growth phase. To begin with, we have to get estimates of the next ten years of cash flows. Where possible we use analyst estimates, but when these aren't available we extrapolate the previous free cash flow (FCF) from the last estimate or reported value. We assume companies with shrinking free cash flow will slow their rate of shrinkage, and that companies with growing free cash flow will see their growth rate slow, over this period. We do this to reflect that growth tends to slow more in the early years than it does in later years.
Generally we assume that a dollar today is more valuable than a dollar in the future, so we discount the value of these future cash flows to their estimated value in today's dollars:
10-year free cash flow (FCF) forecast
| 2024 | 2025 | 2026 | 2027 | 2028 | 2029 | 2030 | 2031 | 2032 | 2033 | |
| Levered FCF ($, Millions) | US$592.7m | US$744.3m | US$616.4m | US$627.8m | US$726.0m | US$727.7m | US$733.9m | US$743.4m | US$755.2m | US$768.8m |
| Growth Rate Estimate Source | Analyst x7 | Analyst x7 | Analyst x5 | Analyst x3 | Analyst x3 | Est @ 0.24% | Est @ 0.86% | Est @ 1.29% | Est @ 1.59% | Est @ 1.80% |
| Present Value ($, Millions) Discounted @ 6.0% | US$559 | US$663 | US$518 | US$498 | US$543 | US$514 | US$489 | US$467 | US$448 | US$430 |
("Est" = FCF growth rate estimated by Simply Wall St)
Present Value of 10-year Cash Flow (PVCF) = US$5.1b
The second stage is also known as Terminal Value, this is the business's cash flow after the first stage. For a number of reasons a very conservative growth rate is used that cannot exceed that of a country's GDP growth. In this case we have used the 5-year average of the 10-year government bond yield (2.3%) to estimate future growth. In the same way as with the 10-year 'growth' period, we discount future cash flows to today's value, using a cost of equity of 6.0%.
Terminal Value (TV)= FCF2033 × (1 + g) ÷ (r – g) = US$769m× (1 + 2.3%) ÷ (6.0%– 2.3%) = US$21b
Present Value of Terminal Value (PVTV)= TV / (1 + r)10= US$21b÷ ( 1 + 6.0%)10= US$12b
The total value, or equity value, is then the sum of the present value of the future cash flows, which in this case is US$17b. To get the intrinsic value per share, we divide this by the total number of shares outstanding. Relative to the current share price of US$35.8, the company appears quite good value at a 44% discount to where the stock price trades currently. The assumptions in any calculation have a big impact on the valuation, so it is better to view this as a rough estimate, not precise down to the last cent.
Important Assumptions
The calculation above is very dependent on two assumptions. The first is the discount rate and the other is the cash flows. You don't have to agree with these inputs, I recommend redoing the calculations yourself and playing with them. The DCF also does not consider the possible cyclicality of an industry, or a company's future capital requirements, so it does not give a full picture of a company's potential performance. Given that we are looking at Maplebear as potential shareholders, the cost of equity is used as the discount rate, rather than the cost of capital (or weighted average cost of capital, WACC) which accounts for debt. In this calculation we've used 6.0%, which is based on a levered beta of 0.800. Beta is a measure of a stock's volatility, compared to the market as a whole. We get our beta from the industry average beta of globally comparable companies, with an imposed limit between 0.8 and 2.0, which is a reasonable range for a stable business.
Looking Ahead:
Although the valuation of a company is important, it is only one of many factors that you need to assess for a company. It's not possible to obtain a foolproof valuation with a DCF model. Rather it should be seen as a guide to "what assumptions need to be true for this stock to be under/overvalued?" For example, changes in the company's cost of equity or the risk free rate can significantly impact the valuation. Why is the intrinsic value higher than the current share price? For Maplebear, we've compiled three further elements you should further research:
- Financial Health: Does CART have a healthy balance sheet? Take a look at our free balance sheet analysis with six simple checks on key factors like leverage and risk.
- Future Earnings: How does CART's growth rate compare to its peers and the wider market? Dig deeper into the analyst consensus number for the upcoming years by interacting with our free analyst growth expectation chart.
- Other High Quality Alternatives: Do you like a good all-rounder? Explore our interactive list of high quality stocks to get an idea of what else is out there you may be missing!
PS. Simply Wall St updates its DCF calculation for every American stock every day, so if you want to find the intrinsic value of any other stock just search here.
New: Manage All Your Stock Portfolios in One Place
We've created the ultimate portfolio companion for stock investors, and it's free.
• Connect an unlimited number of Portfolios and see your total in one currency
• Be alerted to new Warning Signs or Risks via email or mobile
• Track the Fair Value of your stocks
Have feedback on this article? Concerned about the content? Get in touch with us directly. Alternatively, email editorial-team (at) simplywallst.com.
This article by Simply Wall St is general in nature. We provide commentary based on historical data and analyst forecasts only using an unbiased methodology and our articles are not intended to be financial advice. It does not constitute a recommendation to buy or sell any stock, and does not take account of your objectives, or your financial situation. We aim to bring you long-term focused analysis driven by fundamental data. Note that our analysis may not factor in the latest price-sensitive company announcements or qualitative material. Simply Wall St has no position in any stocks mentioned.
About NasdaqGS:CART
Maplebear
Maplebear Inc., doing business as Instacart, engages in the provision of online grocery shopping services to households in North America.
Flawless balance sheet and fair value.
Similar Companies
Market Insights

Advertisement
Community Narratives
100% Patient Improvement in trial puts this $16M Biotech on the radar
Fair Value US$5.30|69.8% undervalued
JO
Community Contributor
Exxon Mobil's 17.5% Upside Promises Industry-Leading Returns in Energy Transition
Fair Value US$132.00|15.0% undervalued
HE
Community Contributor
NHC Analysis: Quality at a Good Price. A Golden Opportunity?
Fair Value US$179.80|36.1% undervalued
DA
Community Contributor
Product Refresh And Global Expansion Will Empower Future Market Leadership
Fair Value US$202.60|21.1% undervalued
AN
Based on Analyst Price Targets