Advertisement
- United States
- /
- Luxury
- /
- NYSE:TPR
Does Tapestry’s Stock Rally Still Make Sense After Five Years of Massive Gains?

Simply Wall St
Reviewed by Bailey Pemberton
Thinking about what to do with Tapestry stock right now? You’re definitely not alone. Over the past year, this standout in the luxury accessories space has posted some jaw-dropping returns. The price soared 163.5% over the last twelve months and rose by a massive 515.0% over five years. If you held Tapestry for the past three years, you have seen your investment climb by 307.1%, and even those who bought in just last week enjoyed a quick 7.9% gain.
Plenty of investors have been drawn in by this growth, especially as the market’s appetite for consumer discretionary stocks has improved. Shifts in global fashion demand, a renewed focus on omni-channel strategies, and Tapestry’s ongoing global expansion have all contributed to this impressive run. Each of these factors seems to have moved risk perceptions in Tapestry’s favor and helped fuel more upward momentum for the stock.
But does this momentum mean Tapestry is currently undervalued? To answer that, we will dive deep into different valuation methods and see how the company stacks up. Tapestry only ticks the box in 1 out of 6 key undervaluation checks, giving it a value score of 1 out of 6. So, let’s unpack what these valuation approaches reveal. There is also an even more insightful way to judge valuation that we will get to at the end.
Tapestry scores just 1/6 on our valuation checks. See what other red flags we found in the full valuation breakdown.
Approach 1: Tapestry Discounted Cash Flow (DCF) Analysis
The Discounted Cash Flow (DCF) model estimates a company's worth by projecting its future cash flows and then discounting them back to their value in today's dollars. This method tries to capture the real, long-term earning power of a business by focusing on cash a company can actually generate for shareholders over time.
For Tapestry, analysts estimate Free Cash Flow (FCF) to be $1.07 Billion over the last twelve months, measured in USD. Projections made by three analysts expect FCF to grow steadily over the next several years, reaching about $1.48 Billion by 2028. Beyond these initial years, further FCF growth is extrapolated with the ten-year outlook showing expected FCF surpassing $2.1 Billion by 2035 as estimated by Simply Wall St.
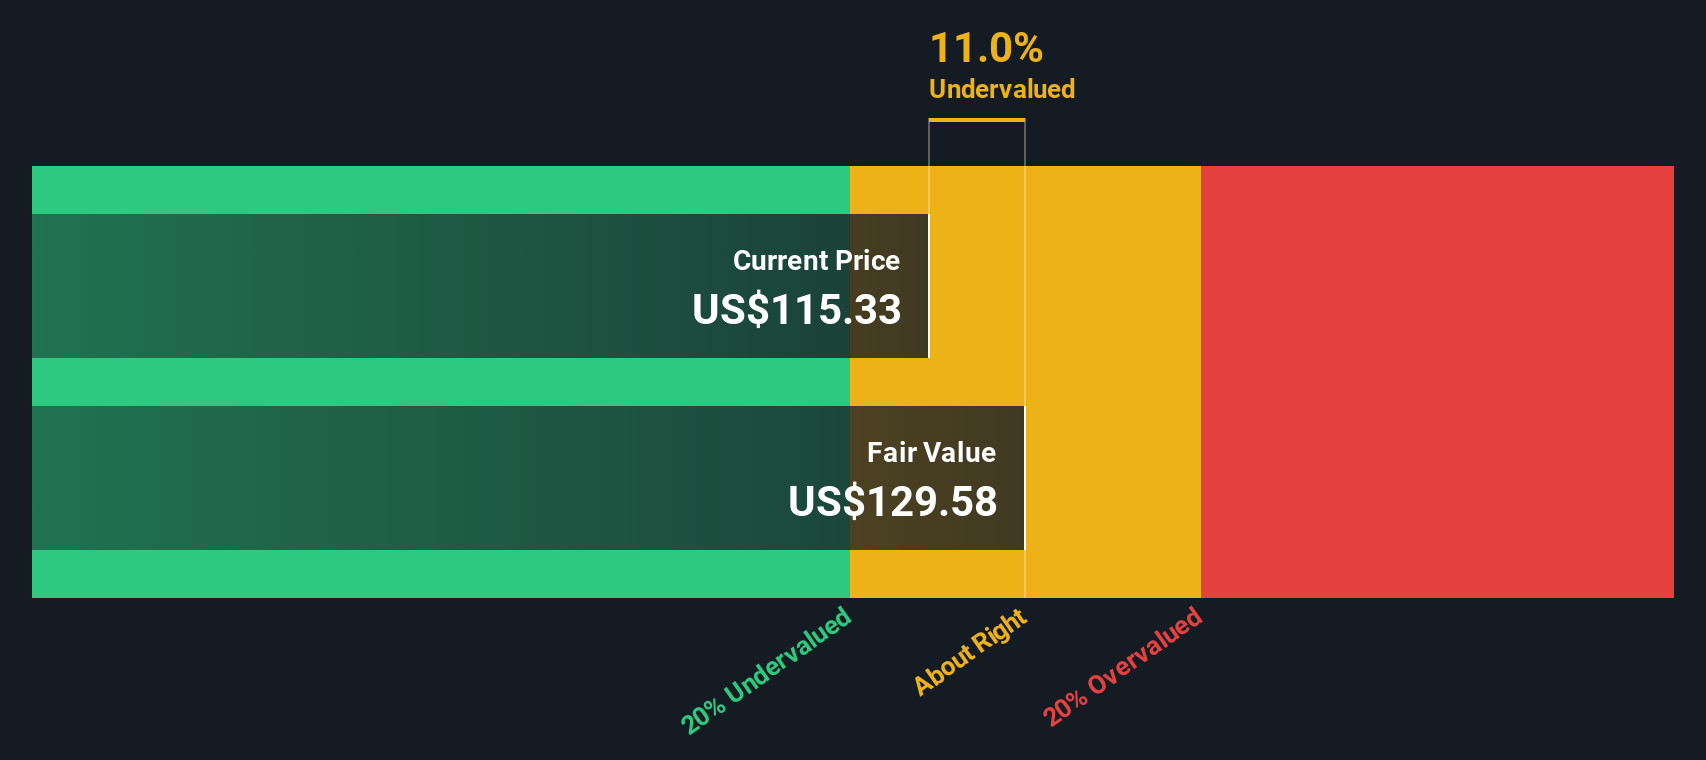
Based on the DCF approach and these cash flow projections, the estimated intrinsic value of Tapestry stock comes in at $129.69 per share. At current market prices, this model suggests the stock is trading at roughly a 9.9% discount to fair value. That puts Tapestry about where it should be, neither significantly undervalued nor overvalued right now.
Result: ABOUT RIGHT
Simply Wall St performs a valuation analysis on every stock in the world every day (check out Tapestry's valuation analysis). We show the entire calculation in full. You can track the result in your watchlist or portfolio and be alerted when this changes.
Approach 2: Tapestry Price vs Earnings
The Price-to-Earnings (PE) ratio is generally considered the gold standard for valuing profitable companies, as it captures how much investors are willing to pay today for a dollar of the company's earnings. This metric is especially useful when comparing established businesses with consistent profitability, such as Tapestry.
Determining what a “normal” or “fair” PE ratio should be depends on growth prospects and the level of risk investors are willing to accept. A higher growth outlook or lower perceived risk typically justifies a higher PE ratio, while slower growth or more uncertainty tends to push the fair level down.
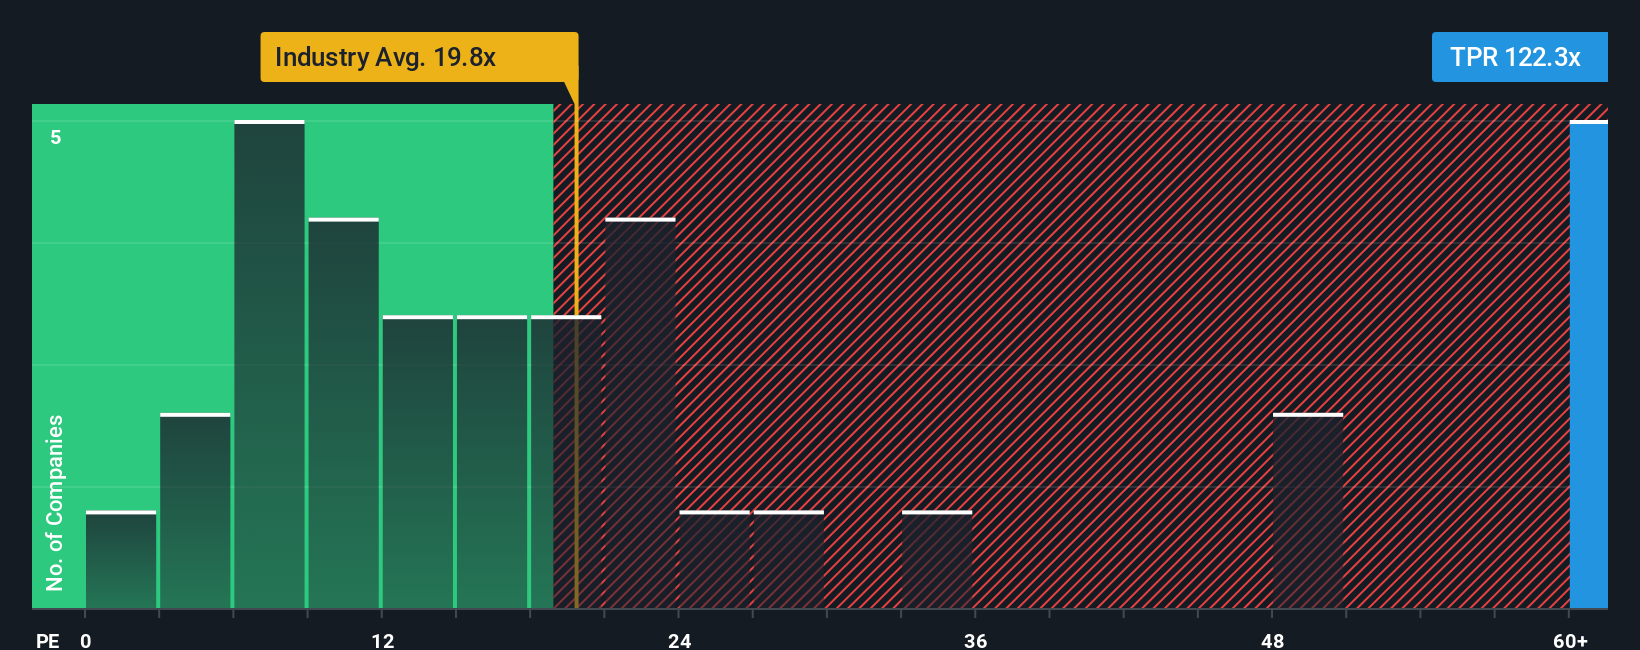
Tapestry currently trades at a PE ratio of 132x. For context, the luxury industry average sits at 19.4x, and the broader peer group trades at an average of 32x. While Tapestry’s multiple is significantly higher, these simple comparisons can overlook key nuances.
This is where Simply Wall St's “Fair Ratio” metric comes in. It estimates the appropriate multiple for a company by considering not just raw industry averages or peer numbers, but also specific aspects like Tapestry’s earnings growth profile, risk factors, profit margin, industry norms, and market cap. For Tapestry, the Fair Ratio is calculated to be 28.4x, which is substantially below its current level.
Since Tapestry’s actual PE is much greater than its Fair Ratio, this suggests the stock is currently trading at a significant premium to what would be justified based on the underlying fundamentals and risk profile.
Result: OVERVALUED
PE ratios tell one story, but what if the real opportunity lies elsewhere? Discover companies where insiders are betting big on explosive growth.
Upgrade Your Decision Making: Choose your Tapestry Narrative
Earlier we mentioned that there's an even better way to understand valuation, so let's introduce you to Narratives. Narratives are a powerful tool that let you connect a company’s story to your own assumptions about the future. Instead of just looking at the numbers, Narratives bring context, expectations, and your perspective together in a single view. On Simply Wall St's Community page, you can easily build and explore Narratives, joining millions of investors who use them to map out their projections for revenue, earnings, and margins, then link those forecasts to a fair value for the stock.
Unlike static ratios, Narratives dynamically update as new news, earnings releases, or events occur, helping you make decisions that always reflect the latest reality. This approach makes it easy to sense-check whether your outlook justifies buying or selling. If your Narrative indicates Tapestry’s fair value is well above the current price, it may present an opportunity. If it’s below, caution could be warranted.
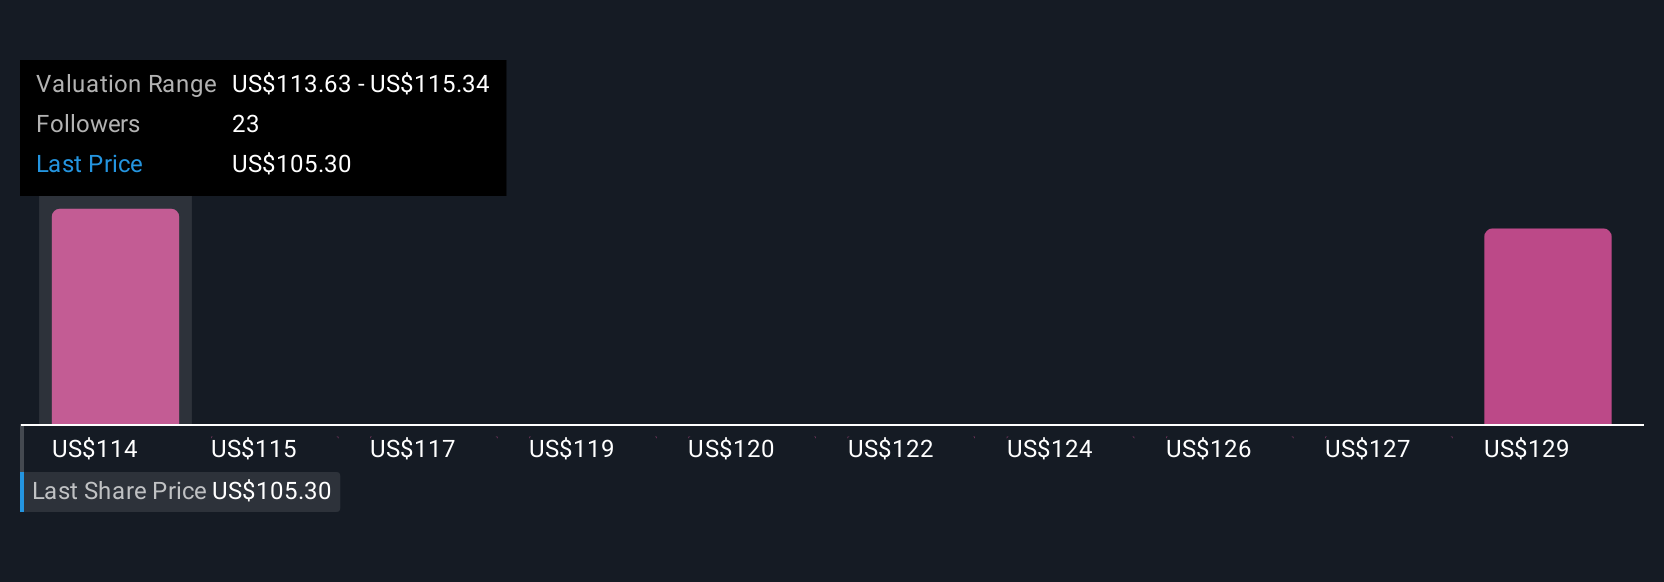
- For example, the most optimistic analyst expects Tapestry could be worth as much as $139 per share, given strong international growth and margin expansion.
- In contrast, the most cautious estimate sets fair value at only $66, highlighting risks like brand pressures and tariffs.
Your investment decisions can now be driven by a Narrative that fits your view, rather than just headline numbers.
Do you think there's more to the story for Tapestry? Create your own Narrative to let the Community know!
This article by Simply Wall St is general in nature. We provide commentary based on historical data and analyst forecasts only using an unbiased methodology and our articles are not intended to be financial advice. It does not constitute a recommendation to buy or sell any stock, and does not take account of your objectives, or your financial situation. We aim to bring you long-term focused analysis driven by fundamental data. Note that our analysis may not factor in the latest price-sensitive company announcements or qualitative material. Simply Wall St has no position in any stocks mentioned.
Valuation is complex, but we're here to simplify it.
Discover if Tapestry might be undervalued or overvalued with our detailed analysis, featuring fair value estimates, potential risks, dividends, insider trades, and its financial condition.
Access Free AnalysisHave feedback on this article? Concerned about the content? Get in touch with us directly. Alternatively, email editorial-team@simplywallst.com
About NYSE:TPR
Tapestry
Provides accessories and lifestyle brand products in North America, Greater China, rest of Asia, and internationally.
Reasonable growth potential with mediocre balance sheet.
Similar Companies
Market Insights

Advertisement
Community Narratives
Kodiak AI - a potential 100 bagger opportunity?
Fair Value US$14.00|44.7% undervalued
DA
Community Contributor
A Fair Price for a Great Business Facing Real Threats
Fair Value US$383.06|13.0% undervalued
IM
Community Contributor
AXON And Shopify Integration Will Unlock Global Mobile Advertising
Fair Value US$646.30|0% overvalued
AN
Based on Analyst Price Targets