Advertisement
- United States
- /
- Consumer Durables
- /
- NYSE:SKY
Assessing Champion Homes After a 22.5% Drop and Industry Volatility in 2025

Simply Wall St
Reviewed by Bailey Pemberton
- Ever wondered if Champion Homes is trading at a bargain, or if that low price is a warning sign? Let’s dig into the numbers and see what’s really going on with the stock.
- The share price has tumbled recently, dropping 12% this week, 12.8% over the past month, and sliding 22.5% so far this year. This puts it well below last year’s mark.
- Market sentiment has shifted following reports of changes in the U.S. housing sector and analyst upgrades for several homebuilders. These two trends have added momentum and volatility to the entire industry. These headlines have played a role in the recent pricing shakeup for Champion Homes.
- Champion Homes currently has a valuation score of 2 out of 6, suggesting there is room for debate about its fair value. Let’s break down the usual ways investors assess a stock’s worth, and then we’ll reveal a smarter approach to valuation at the end of this article.
Champion Homes scores just 2/6 on our valuation checks. See what other red flags we found in the full valuation breakdown.
Approach 1: Champion Homes Discounted Cash Flow (DCF) Analysis
A Discounted Cash Flow (DCF) valuation projects a company’s future cash flows and discounts them back to today’s dollars. This process estimates what the business is truly worth based on those future earnings. This approach helps investors determine whether the current share price reflects that intrinsic value.
For Champion Homes, the latest reported Free Cash Flow (FCF) is $175.7 million. Analysts expect FCF to grow steadily, reaching $219.8 million by the fiscal year ending March 2028. Projections continue beyond that period, estimating FCF could rise to approximately $304 million by 2035. However, these later forecasts are less certain because they are extrapolated beyond the analysts’ five-year horizon. All cash flow figures are reported in US dollars.
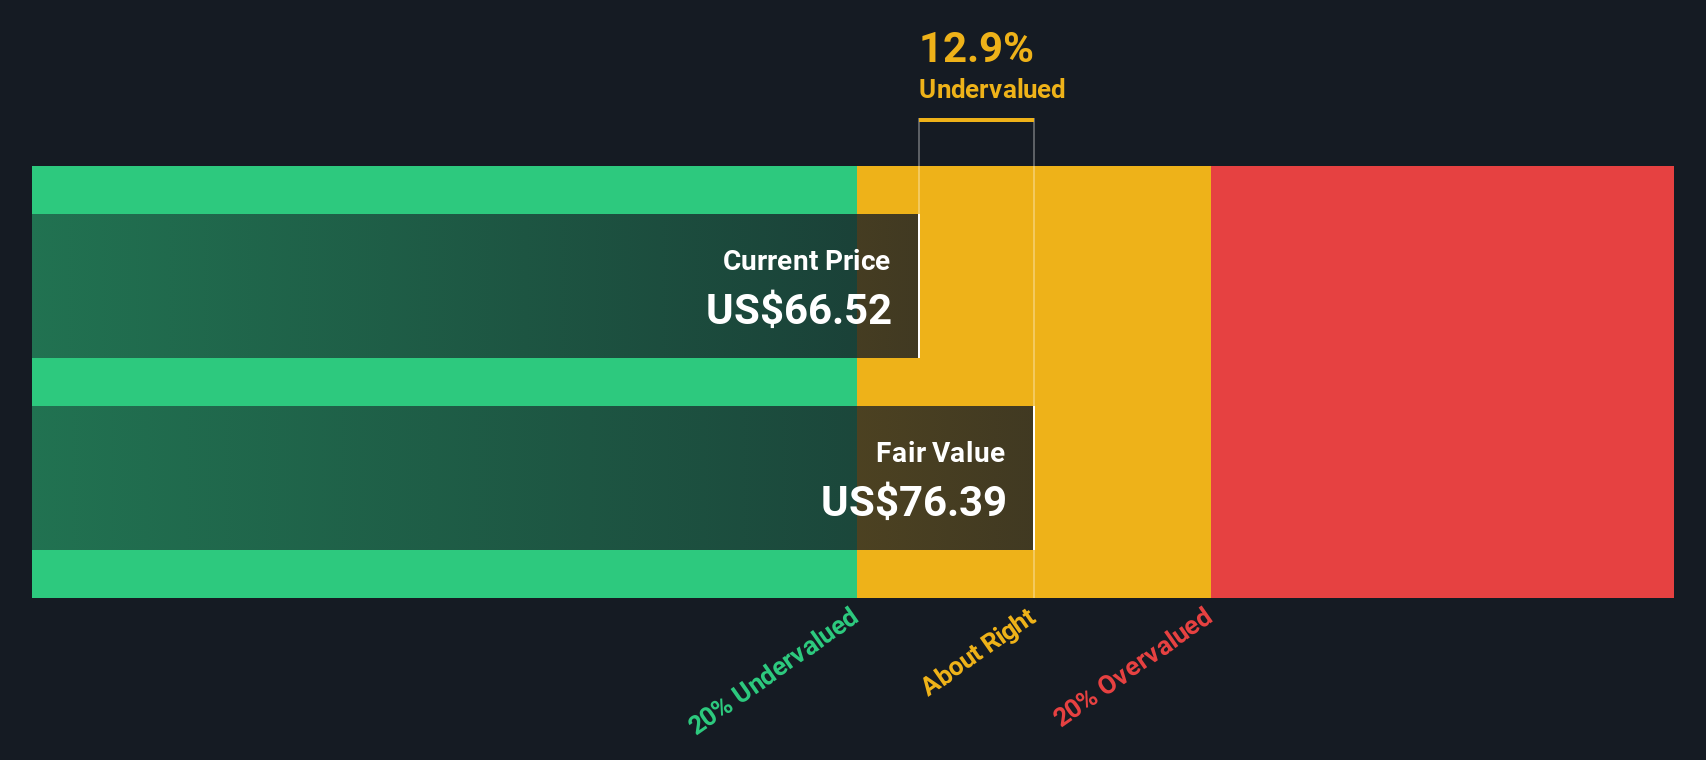
Based on these cash flow estimations and a two-stage DCF approach, the intrinsic value of Champion Homes shares is calculated at $76.60. This valuation implies that the stock is currently trading at a 13.1% discount compared to its fair value according to cash flow fundamentals.
In summary, Champion Homes appears to be undervalued at today’s price, as the DCF analysis reveals room for potential upside.
Result: UNDERVALUED
Our Discounted Cash Flow (DCF) analysis suggests Champion Homes is undervalued by 13.1%. Track this in your watchlist or portfolio, or discover 843 more undervalued stocks based on cash flows.
Approach 2: Champion Homes Price vs Earnings (P/E Ratio)
For profitable companies like Champion Homes, the Price-to-Earnings (P/E) ratio is a widely used metric because it links the company’s market value directly to its current earnings. It gives investors a sense of how much they are paying for each dollar of earnings generated, making it a useful benchmark when comparing similar businesses.
However, a “normal” or fair P/E ratio is not one-size-fits-all. It often reflects a company’s expected growth rate and the riskiness of its business. High-growth or lower-risk companies can justify higher P/E ratios, while those facing slower growth or more uncertainty might trade at lower levels.
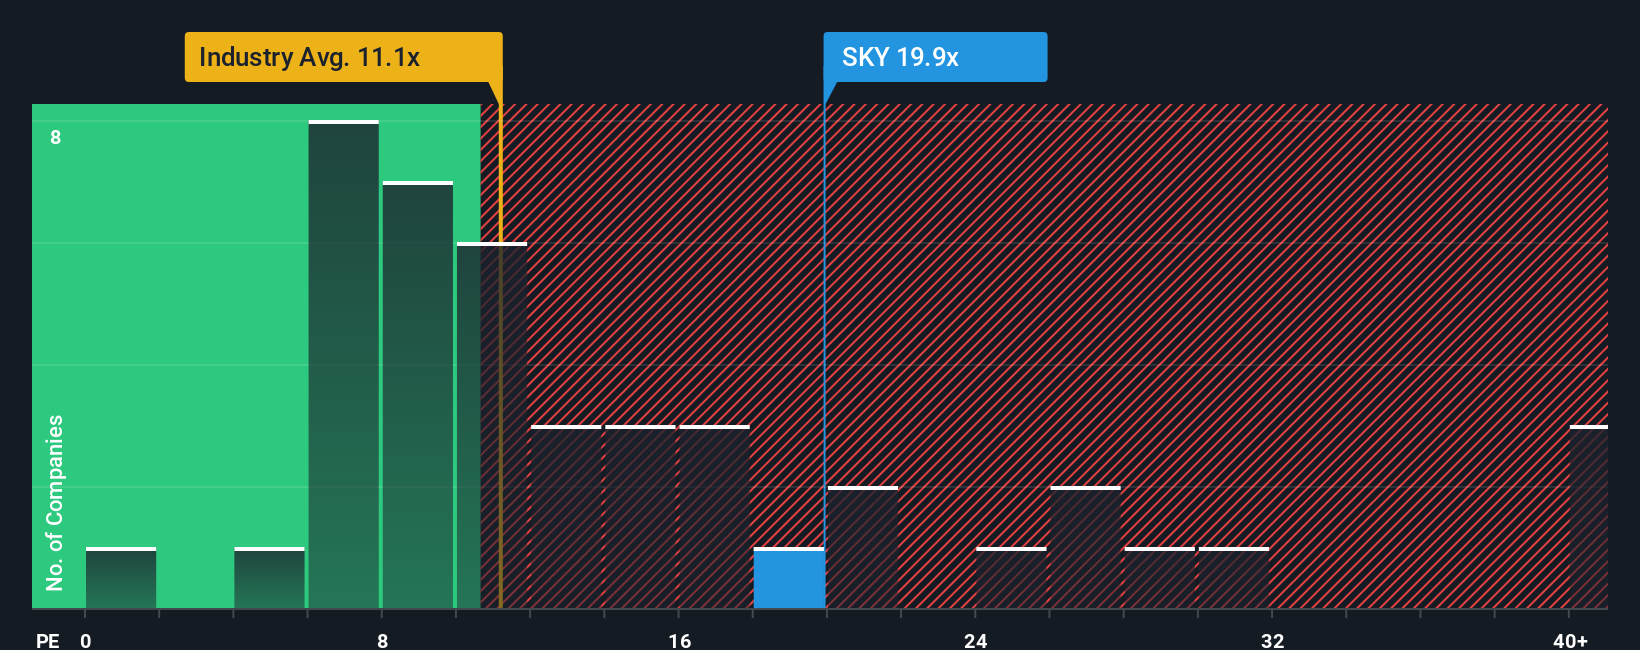
Champion Homes currently trades at a P/E ratio of 17.3x. That is notably higher than both the Consumer Durables industry average of 10.4x and its peer group average of 11.1x. Simply Wall St’s proprietary “Fair Ratio” calculation for Champion Homes is 13.3x, which adjusts for the company’s unique growth prospects, profitability, risk profile, and market cap. This provides a tailored benchmark that goes beyond broad comparisons to peers or the industry.
The Fair Ratio stands at 13.3x, meaning Champion Homes is trading above what would be considered fair value based on its fundamentals and outlook.
Result: OVERVALUED
PE ratios tell one story, but what if the real opportunity lies elsewhere? Discover 1410 companies where insiders are betting big on explosive growth.
Upgrade Your Decision Making: Choose your Champion Homes Narrative
Earlier, we mentioned that there is an even better way to understand valuation, so let’s introduce you to Narratives. Narratives are Simply Wall St’s unique feature that lets you create and follow a story about a company, connecting your view of the business’s future with specific revenue, earnings, and margin estimates to reach your own fair value.
This approach goes beyond the numbers and ties together your knowledge, forecasts, and convictions to form a dynamic, living story. It links company news, market catalysts, or industry changes directly into your personal investment decision, whether you are bullish or bearish. Narratives are user-friendly and easily accessible on the Simply Wall St Community page, empowering millions of investors to see how new data could affect their outlook and whether the current price presents a buy or sell opportunity.
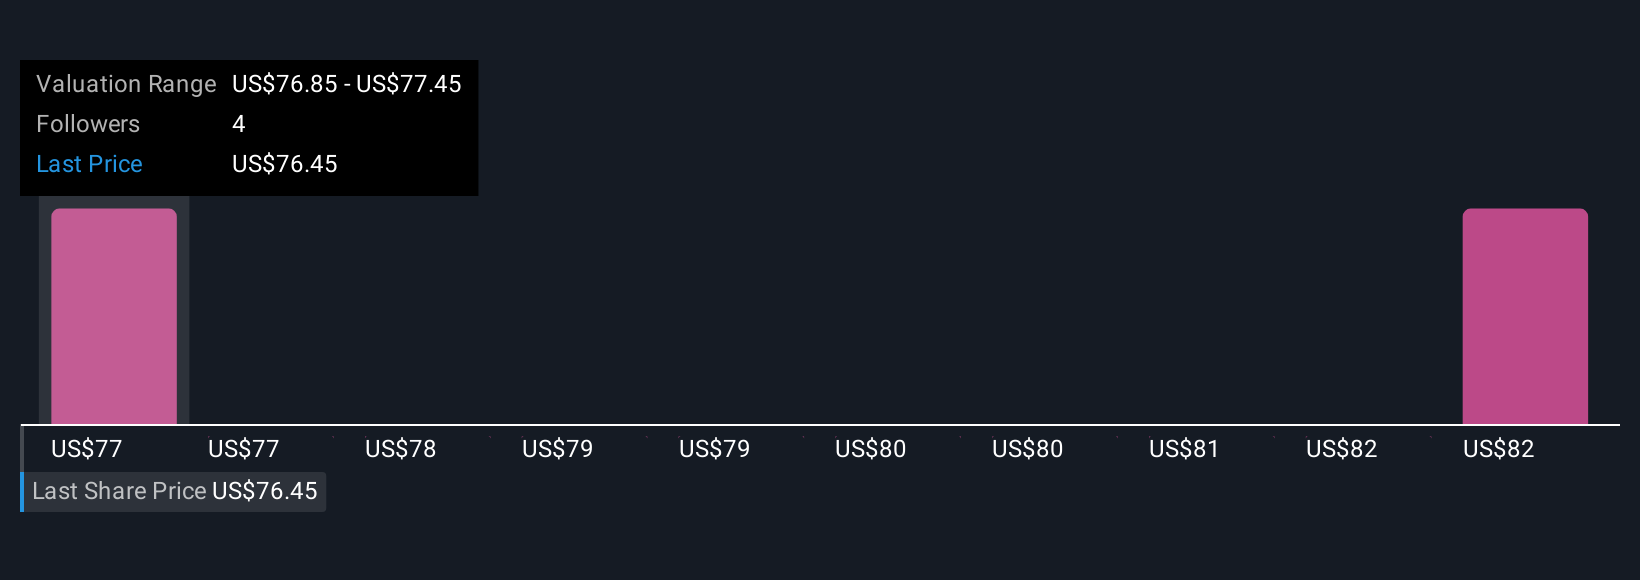
Whenever key news or results come in, your Narrative updates instantly, ensuring your fair value always reflects the freshest information. For example, one investor might think Champion Homes is worth as much as $96.00 based on strong growth expectations and supportive policies. Another, wary of slowing demand and margin pressure, could have a target as low as $72.00.
Do you think there's more to the story for Champion Homes? Head over to our Community to see what others are saying!
This article by Simply Wall St is general in nature. We provide commentary based on historical data and analyst forecasts only using an unbiased methodology and our articles are not intended to be financial advice. It does not constitute a recommendation to buy or sell any stock, and does not take account of your objectives, or your financial situation. We aim to bring you long-term focused analysis driven by fundamental data. Note that our analysis may not factor in the latest price-sensitive company announcements or qualitative material. Simply Wall St has no position in any stocks mentioned.
New: AI Stock Screener & Alerts
Our new AI Stock Screener scans the market every day to uncover opportunities.
• Dividend Powerhouses (3%+ Yield)
• Undervalued Small Caps with Insider Buying
• High growth Tech and AI Companies
Or build your own from over 50 metrics.
Have feedback on this article? Concerned about the content? Get in touch with us directly. Alternatively, email editorial-team@simplywallst.com
About NYSE:SKY
Champion Homes
Produces and sells factory-built housing in the United States and Canada.
Flawless balance sheet with solid track record.
Similar Companies
Market Insights

Advertisement
Community Narratives
The company that turned a verb into a global necessity and basically runs the modern internet, digital ads, smartphones, maps, and AI.
Fair Value US$300.00|5.4% undervalued
OS
Community Contributor
Flowers Foods Pays A Fair Price For Health
Fair Value US$16.12|26.3% undervalued
NV
Community Contributor
TMX Group will thrive with 33.3% profit margin and enduring market moat
Fair Value CA$49.90|4.1% overvalued
LI
Community Contributor
The "Molecular Pencil": Why Beam's Technology is Built to Win
Fair Value US$65.01|62.7% undervalued
DA
Community Contributor