
Advertisement
- United States
- /
- Consumer Durables
- /
- NYSE:DHI
Is D.R. Horton, Inc.'s (NYSE:DHI) Recent Stock Performance Tethered To Its Strong Fundamentals?

Most readers would already be aware that D.R. Horton's (NYSE:DHI) stock increased significantly by 5.5% over the past month. Since the market usually pay for a company’s long-term fundamentals, we decided to study the company’s key performance indicators to see if they could be influencing the market. Particularly, we will be paying attention to D.R. Horton's ROE today.
Return on Equity or ROE is a test of how effectively a company is growing its value and managing investors’ money. Put another way, it reveals the company's success at turning shareholder investments into profits.
We check all companies for important risks. See what we found for D.R. Horton in our free report.How Do You Calculate Return On Equity?
The formula for return on equity is:
Return on Equity = Net Profit (from continuing operations) ÷ Shareholders' Equity
So, based on the above formula, the ROE for D.R. Horton is:
17% = US$4.3b ÷ US$25b (Based on the trailing twelve months to March 2025).
The 'return' is the yearly profit. That means that for every $1 worth of shareholders' equity, the company generated $0.17 in profit.
Check out our latest analysis for D.R. Horton
Why Is ROE Important For Earnings Growth?
We have already established that ROE serves as an efficient profit-generating gauge for a company's future earnings. Based on how much of its profits the company chooses to reinvest or "retain", we are then able to evaluate a company's future ability to generate profits. Assuming all else is equal, companies that have both a higher return on equity and higher profit retention are usually the ones that have a higher growth rate when compared to companies that don't have the same features.
A Side By Side comparison of D.R. Horton's Earnings Growth And 17% ROE
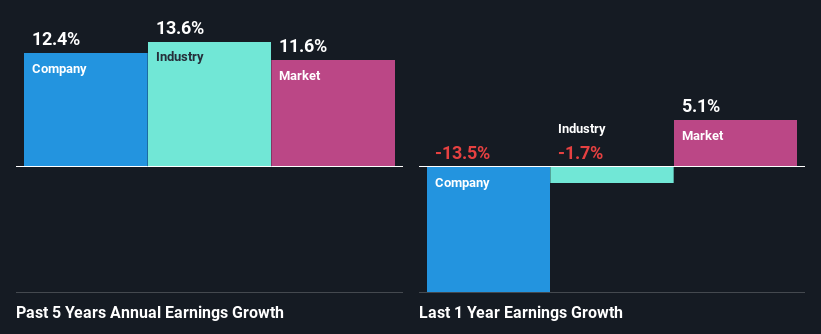
To begin with, D.R. Horton seems to have a respectable ROE. Even when compared to the industry average of 15% the company's ROE looks quite decent. Consequently, this likely laid the ground for the decent growth of 12% seen over the past five years by D.R. Horton.
Next, on comparing D.R. Horton's net income growth with the industry, we found that the company's reported growth is similar to the industry average growth rate of 14% over the last few years.
Earnings growth is an important metric to consider when valuing a stock. What investors need to determine next is if the expected earnings growth, or the lack of it, is already built into the share price. By doing so, they will have an idea if the stock is headed into clear blue waters or if swampy waters await. One good indicator of expected earnings growth is the P/E ratio which determines the price the market is willing to pay for a stock based on its earnings prospects. So, you may want to check if D.R. Horton is trading on a high P/E or a low P/E, relative to its industry.
Is D.R. Horton Making Efficient Use Of Its Profits?
In D.R. Horton's case, its respectable earnings growth can probably be explained by its low three-year median payout ratio of 7.2% (or a retention ratio of 93%), which suggests that the company is investing most of its profits to grow its business.
Moreover, D.R. Horton is determined to keep sharing its profits with shareholders which we infer from its long history of paying a dividend for at least ten years. Upon studying the latest analysts' consensus data, we found that the company's future payout ratio is expected to rise to 13% over the next three years. However, the company's ROE is not expected to change by much despite the higher expected payout ratio.
Conclusion
In total, we are pretty happy with D.R. Horton's performance. Particularly, we like that the company is reinvesting heavily into its business, and at a high rate of return. Unsurprisingly, this has led to an impressive earnings growth. Having said that, the company's earnings growth is expected to slow down, as forecasted in the current analyst estimates. To know more about the latest analysts predictions for the company, check out this visualization of analyst forecasts for the company.
New: Manage All Your Stock Portfolios in One Place
We've created the ultimate portfolio companion for stock investors, and it's free.
• Connect an unlimited number of Portfolios and see your total in one currency
• Be alerted to new Warning Signs or Risks via email or mobile
• Track the Fair Value of your stocks
Have feedback on this article? Concerned about the content? Get in touch with us directly. Alternatively, email editorial-team (at) simplywallst.com.
This article by Simply Wall St is general in nature. We provide commentary based on historical data and analyst forecasts only using an unbiased methodology and our articles are not intended to be financial advice. It does not constitute a recommendation to buy or sell any stock, and does not take account of your objectives, or your financial situation. We aim to bring you long-term focused analysis driven by fundamental data. Note that our analysis may not factor in the latest price-sensitive company announcements or qualitative material. Simply Wall St has no position in any stocks mentioned.
About NYSE:DHI
D.R. Horton
Operates as a homebuilding company in East, North, Southeast, South Central, Southwest, and Northwest regions in the United States.
Excellent balance sheet, good value and pays a dividend.
Similar Companies
Market Insights


Advertisement
Community Narratives
A case for TSXV:USA to reach USD $5.00 - $9.00 (CAD $7.30–$12.29) by 2029.
Fair Value CA$12.29|91.2% undervalued
AG
Community Contributor
DLocal's Future Growth Fueled by 35% Revenue and Profit Margin Boosts
Fair Value US$195.39|94.1% undervalued
WY
Community Contributor
Historically Cheap, but the Margin of Safety Is Still Thin
Fair Value SEK 232.58|12.7% undervalued
MA
Community Contributor