
Advertisement
- United States
- /
- Leisure
- /
- NasdaqCM:TRON
Companies Like Tron (NASDAQ:TRON) Are In A Position To Invest In Growth
We can readily understand why investors are attracted to unprofitable companies. For example, Tron (NASDAQ:TRON) shareholders have done very well over the last year, with the share price soaring by 463%. Nonetheless, only a fool would ignore the risk that a loss making company burns through its cash too quickly.
In light of its strong share price run, we think now is a good time to investigate how risky Tron's cash burn is. For the purpose of this article, we'll define cash burn as the amount of cash the company is spending each year to fund its growth (also called its negative free cash flow). First, we'll determine its cash runway by comparing its cash burn with its cash reserves.
How Long Is Tron's Cash Runway?
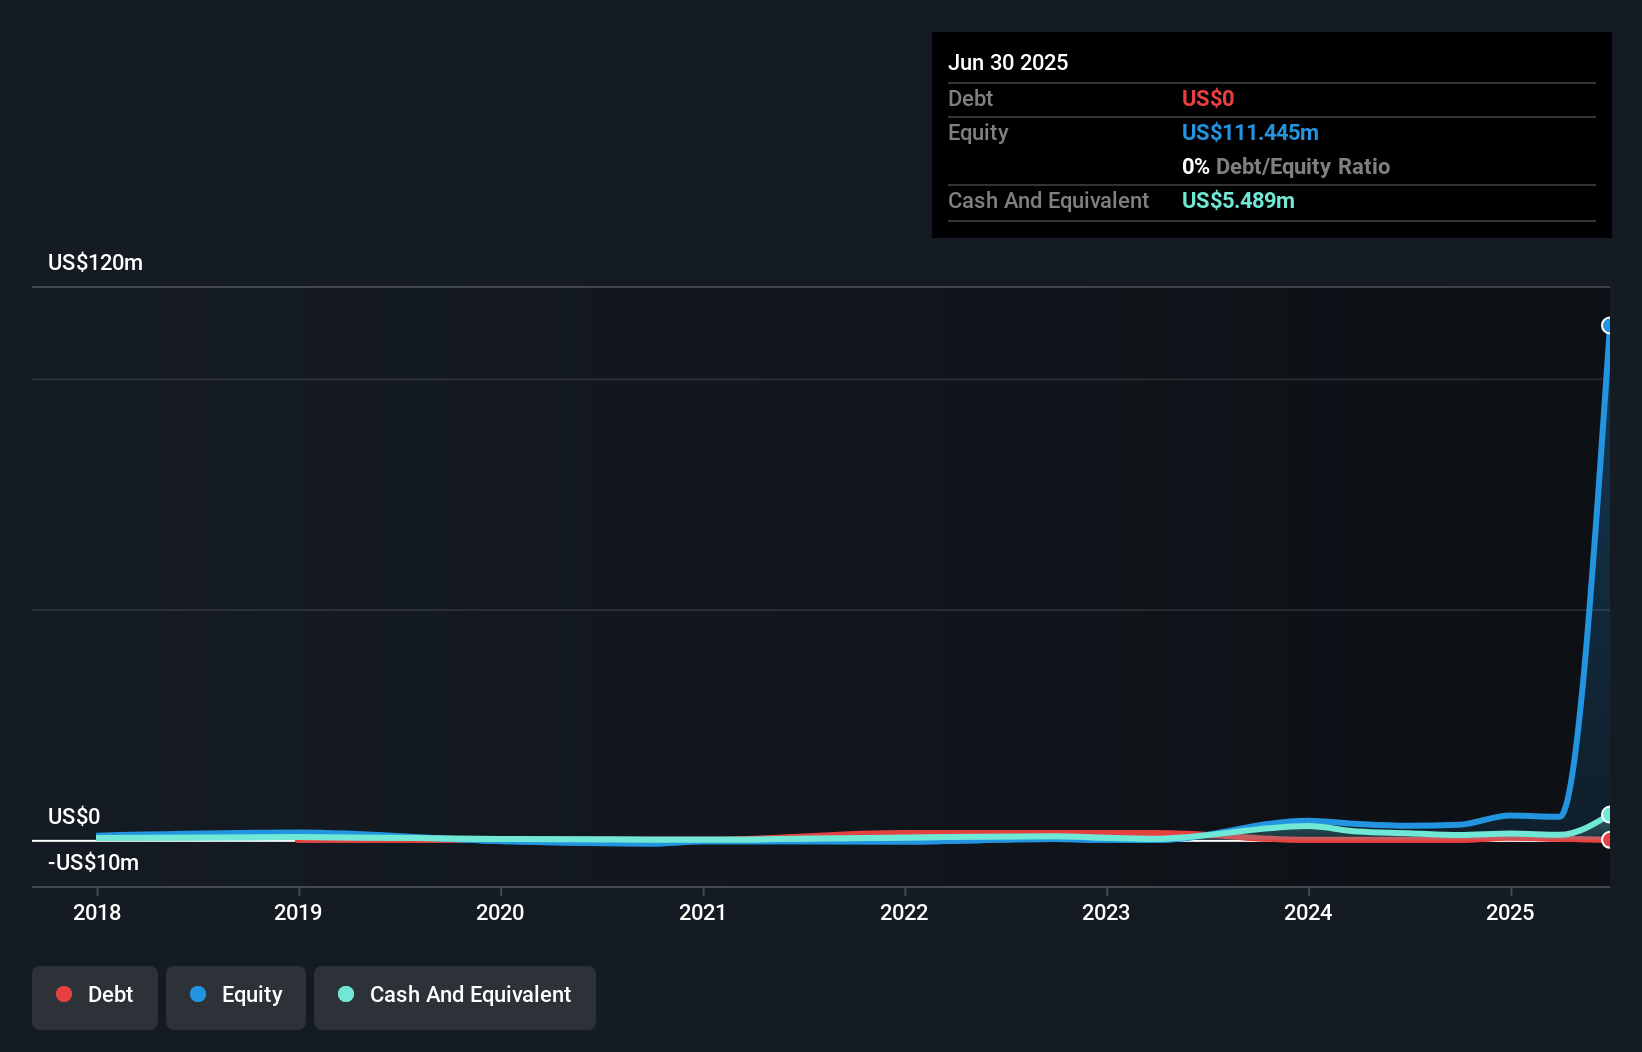
You can calculate a company's cash runway by dividing the amount of cash it has by the rate at which it is spending that cash. When Tron last reported its June 2025 balance sheet in August 2025, it had zero debt and cash worth US$5.5m. In the last year, its cash burn was US$1.8m. Therefore, from June 2025 it had 3.1 years of cash runway. A runway of this length affords the company the time and space it needs to develop the business. You can see how its cash balance has changed over time in the image below.
View our latest analysis for Tron
How Well Is Tron Growing?
It was fairly positive to see that Tron reduced its cash burn by 34% during the last year. But the revenue dip of 13% in the same period was a bit concerning. Considering the factors above, the company doesn’t fare badly when it comes to assessing how it is changing over time. In reality, this article only makes a short study of the company's growth data. You can take a look at how Tron has developed its business over time by checking this visualization of its revenue and earnings history.
How Easily Can Tron Raise Cash?
While Tron seems to be in a decent position, we reckon it is still worth thinking about how easily it could raise more cash, if that proved desirable. Issuing new shares, or taking on debt, are the most common ways for a listed company to raise more money for its business. Many companies end up issuing new shares to fund future growth. We can compare a company's cash burn to its market capitalisation to get a sense for how many new shares a company would have to issue to fund one year's operations.
Tron has a market capitalisation of US$144m and burnt through US$1.8m last year, which is 1.2% of the company's market value. So it could almost certainly just borrow a little to fund another year's growth, or else easily raise the cash by issuing a few shares.
How Risky Is Tron's Cash Burn Situation?
It may already be apparent to you that we're relatively comfortable with the way Tron is burning through its cash. For example, we think its cash runway suggests that the company is on a good path. Although its falling revenue does give us reason for pause, the other metrics we discussed in this article form a positive picture overall. After taking into account the various metrics mentioned in this report, we're pretty comfortable with how the company is spending its cash, as it seems on track to meet its needs over the medium term. Taking a deeper dive, we've spotted 5 warning signs for Tron you should be aware of, and 3 of them are a bit unpleasant.
Of course, you might find a fantastic investment by looking elsewhere. So take a peek at this free list of interesting companies, and this list of stocks growth stocks (according to analyst forecasts)
Valuation is complex, but we're here to simplify it.
Discover if Tron might be undervalued or overvalued with our detailed analysis, featuring fair value estimates, potential risks, dividends, insider trades, and its financial condition.
Access Free AnalysisHave feedback on this article? Concerned about the content? Get in touch with us directly. Alternatively, email editorial-team (at) simplywallst.com.
This article by Simply Wall St is general in nature. We provide commentary based on historical data and analyst forecasts only using an unbiased methodology and our articles are not intended to be financial advice. It does not constitute a recommendation to buy or sell any stock, and does not take account of your objectives, or your financial situation. We aim to bring you long-term focused analysis driven by fundamental data. Note that our analysis may not factor in the latest price-sensitive company announcements or qualitative material. Simply Wall St has no position in any stocks mentioned.
About NasdaqCM:TRON
Tron
Designs, manufactures, and sells toys and souvenirs to theme parks and entertainment venues in the United States, China, Japan, and Europe.
Flawless balance sheet with moderate risk.
Market Insights

Advertisement
Community Narratives
Kodiak AI - a potential 100 bagger opportunity?
Fair Value US$14.00|41.9% undervalued
DA
Community Contributor
A Fair Price for a Great Business Facing Real Threats
Fair Value US$383.06|14.1% undervalued
IM
Community Contributor
AXON And Shopify Integration Will Unlock Global Mobile Advertising
Fair Value US$613.59|1.2% undervalued
AN
Based on Analyst Price Targets