Advertisement
- United States
- /
- Consumer Durables
- /
- NasdaqGS:NWL
Does Newell Brands Offer Potential Value After Sharp Five Year Slide?

Simply Wall St
Reviewed by Bailey Pemberton
If you have been looking at Newell Brands and wondering whether now is the time to buy, hold, or move on, you are definitely not alone. The stock has had a turbulent ride, to say the least. In just the last week, shares crept up by 1.1%, but step back a little and you will find a more sobering story. The stock is down 10.9% over the last month and has lost almost half its value year-to-date. Looking even further back, the drop is even steeper, with a 26.1% decline in the past year and a massive 64.5% slide over the past five years.
These big moves are not just about broad market jitters or changing consumer sentiment. Newell Brands, which makes products found in just about every home, is finding itself at the center of shifting investor attitudes towards brand-heavy consumer goods companies. Market developments like persistent inflation and evolving retailer dynamics have definitely played their part in reshaping how much risk investors want to take on a name like this and what kind of growth they are willing to wait for.
However, even after all these declines, Newell Brands earns a valuation score of 5 out of 6 in our checks for undervalued stocks. That means it looks like a real bargain according to most of the standard valuation yardsticks analysts use. In the next section, we will break down exactly how these different methods help size up Newell’s value. And if you want something deeper than just the usual numbers, stay tuned to the end for a perspective that might change how you judge what value really means.
Why Newell Brands is lagging behind its peers
Approach 1: Newell Brands Discounted Cash Flow (DCF) Analysis
The Discounted Cash Flow (DCF) model estimates a company’s value by projecting its future cash flows and then discounting those amounts back to value them in today’s dollars. This approach is commonly used by analysts to estimate the “real” worth of a stock, based on what the business can be expected to earn over time.
For Newell Brands, the most recent data shows last twelve months’ Free Cash Flow (FCF) was a loss of $98.4 million. However, analysts expect a significant turnaround. Projections show the company’s annual FCF increasing to $318.9 million by 2026 and reaching $523.2 million by 2035. Simply Wall St extends analyst estimates beyond 5 years by extrapolating growth based on historical trends and provided data.
Using these forecasts, the DCF model calculates an intrinsic or “fair” value of $9.97 per share. Compared to the current market price, this suggests Newell Brands is trading at a 47.8% discount to its intrinsic value. In other words, if the assumptions hold, the stock appears significantly undervalued according to this model.
Result: UNDERVALUED
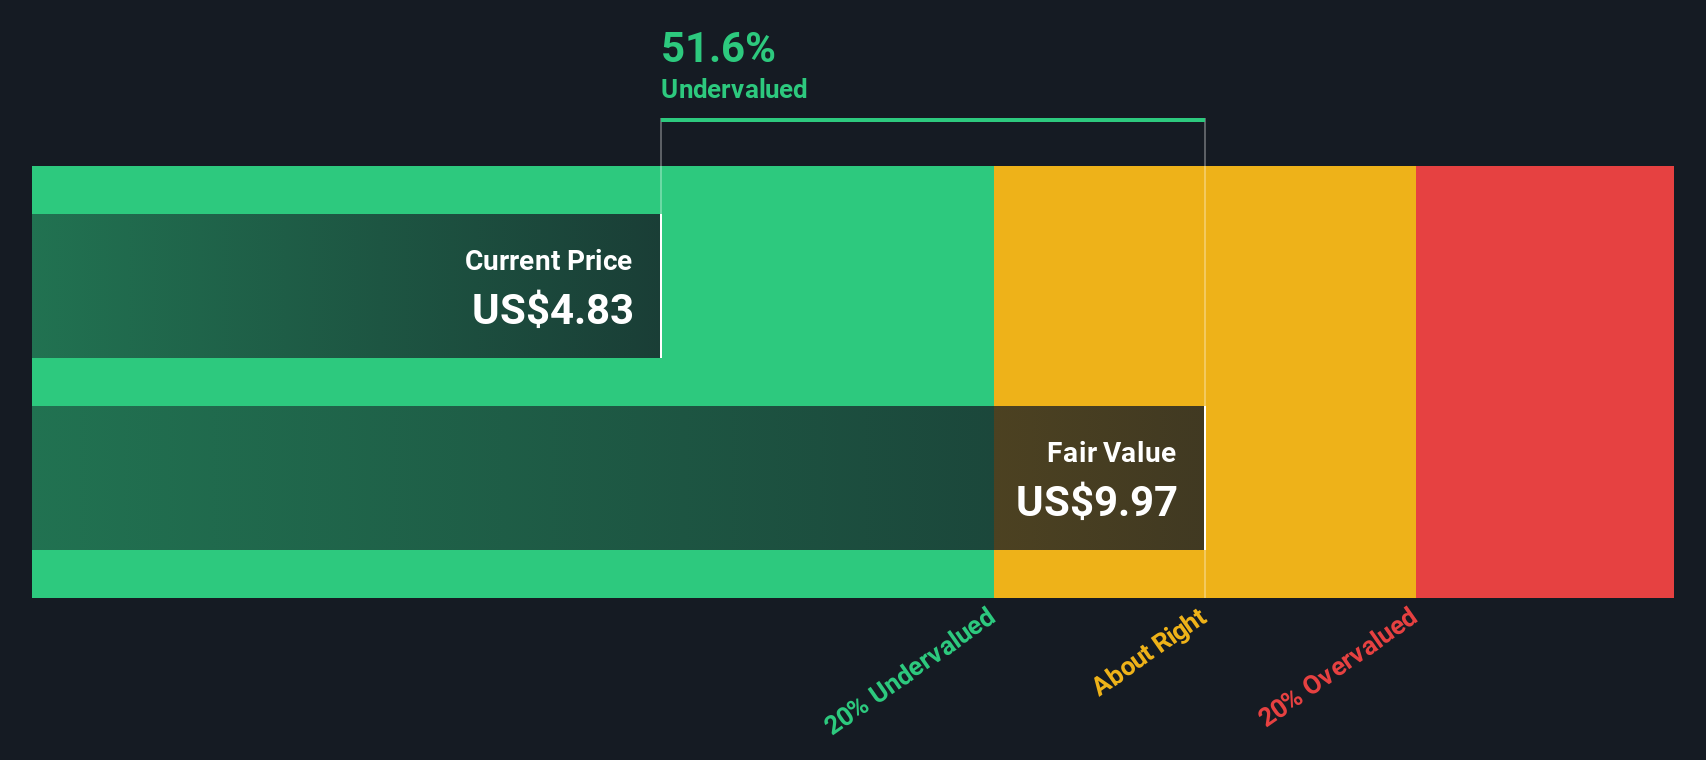
Our Discounted Cash Flow (DCF) analysis suggests Newell Brands is undervalued by 47.8%. Track this in your watchlist or portfolio, or discover more undervalued stocks.
Approach 2: Newell Brands Price vs Sales
The Price-to-Sales (P/S) ratio is a widely used valuation metric, especially for companies like Newell Brands that may be facing inconsistent profits but still generate significant revenue. It is a helpful tool for assessing whether a stock is fairly valued relative to its current sales, making it suitable in cases where earnings are volatile or negative.
Generally, higher growth expectations and lower perceived risk allow companies to justify a higher P/S ratio. Conversely, companies with slow growth or elevated risks are typically valued at lower ratios. This is important when comparing Newell Brands to its Consumer Durables industry peers and the broader market.
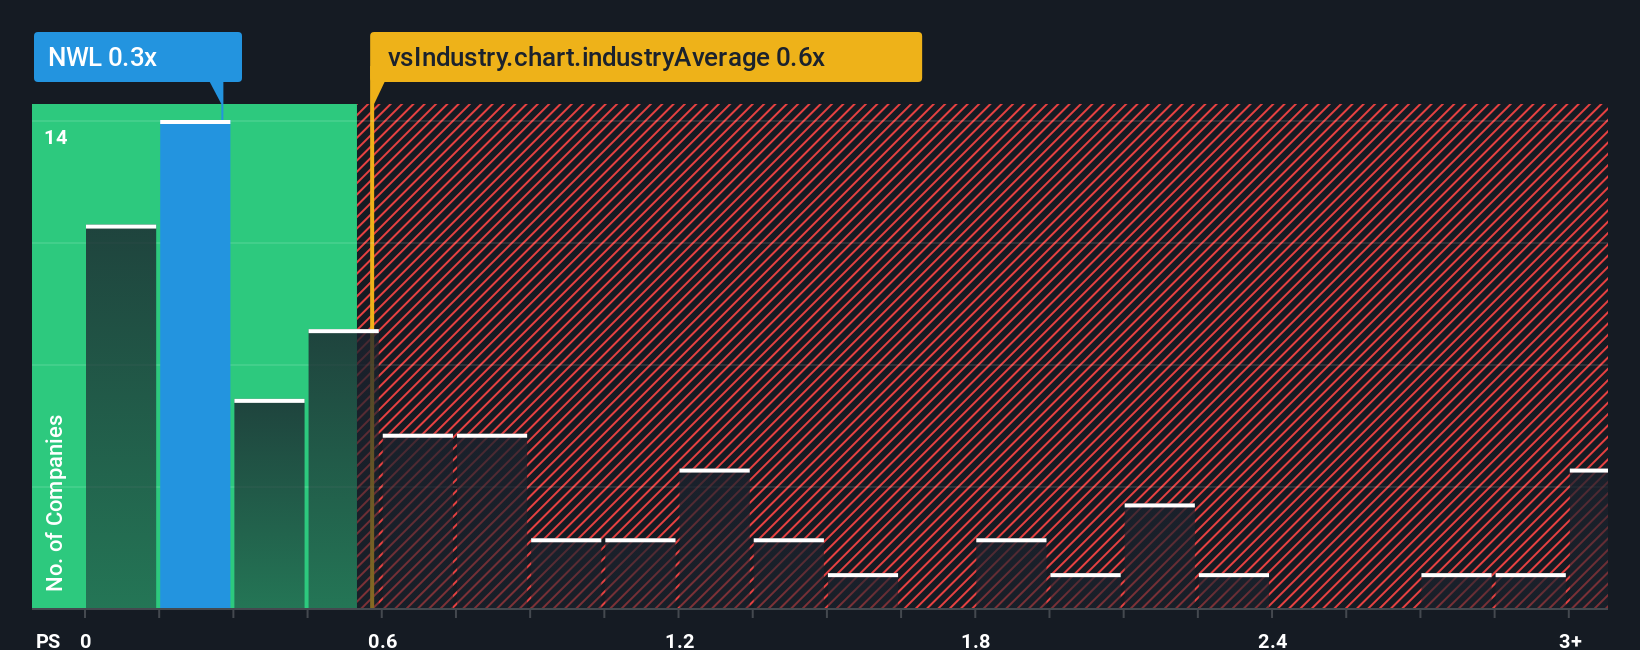
Currently, Newell Brands trades at a P/S ratio of 0.29x. This is much lower than the Consumer Durables industry average of 0.64x and the peer average of 0.97x, both of which reflect where investors have typically priced similar businesses. However, to go beyond averages, Simply Wall St calculates a "Fair Ratio," which in this case is 0.75x. The Fair Ratio goes further than broad comparisons, factoring in specific elements like Newell’s expected growth, risks, profit margins, its industry classification, and market cap. This delivers a tailored benchmark for what the company’s true multiple should be given its unique situation.
With Newell Brands’ actual P/S ratio of 0.29x well below its Fair Ratio of 0.75x, the stock appears meaningfully undervalued on this metric as well.
Result: UNDERVALUED
PS ratios tell one story, but what if the real opportunity lies elsewhere? Discover companies where insiders are betting big on explosive growth.
Upgrade Your Decision Making: Choose your Newell Brands Narrative
Earlier we mentioned there is a better way to understand valuation, so let’s introduce you to Narratives. Narratives are a simple concept: they let you explain your perspective on a company by linking its story (how you see its future business changes, risks, and opportunities) with your own financial estimates like fair value, future revenue, earnings, and margins.
Instead of getting lost in static numbers, Narratives help you connect the company’s journey to a concrete forecast and then to a fair value, making sense of why you or others might think a stock is a bargain or not. This tool is available right on Simply Wall St’s Community page, giving millions of investors a practical way to build, edit, and compare their investment theses.
Narratives actively guide your buy or sell decisions by making it easy to compare your calculated fair value with the current price; they even update automatically whenever there’s major news or new earnings, keeping your view fresh and informed.
For example, with Newell Brands, one Narrative could point to manufacturing innovation and digital expansion for a bullish $9.00 fair value, while another highlights margin risks and high leverage for a bearish $5.00 value. This demonstrates how different stories and assumptions produce sharply different conclusions about the same stock.
Do you think there's more to the story for Newell Brands? Create your own Narrative to let the Community know!

This article by Simply Wall St is general in nature. We provide commentary based on historical data and analyst forecasts only using an unbiased methodology and our articles are not intended to be financial advice. It does not constitute a recommendation to buy or sell any stock, and does not take account of your objectives, or your financial situation. We aim to bring you long-term focused analysis driven by fundamental data. Note that our analysis may not factor in the latest price-sensitive company announcements or qualitative material. Simply Wall St has no position in any stocks mentioned.
Valuation is complex, but we're here to simplify it.
Discover if Newell Brands might be undervalued or overvalued with our detailed analysis, featuring fair value estimates, potential risks, dividends, insider trades, and its financial condition.
Access Free AnalysisHave feedback on this article? Concerned about the content? Get in touch with us directly. Alternatively, email editorial-team@simplywallst.com
About NasdaqGS:NWL
Newell Brands
Engages in the design, manufacture, sourcing, and distribution of consumer and commercial products worldwide.
Undervalued with moderate growth potential.
Similar Companies
Market Insights

Advertisement
Community Narratives
The Next Phase of Energy Storage: How NeoVolta Is Tackling America’s Power Crunch
Fair Value US$7.50|35.2% undervalued
MA
Community Contributor
Why EnSilica is Worth Possibly 13x its Current Price
Fair Value UK£5.00|90.0% undervalued
DO
Community Contributor
M&A Activity, Industry Diversification & A Defense Contract Monopoly Will Push BWXT For Healthy Long-Term Growth
Fair Value US$220.00|15.6% undervalued
CL
Community Contributor
A case for Cassiar Gold Corp (TSXV: GLDC) to reach CAD$8-10 before 2030 (X30-37)
Fair Value CA$10.00|97.1% undervalued
AG
Community Contributor