Advertisement
- United States
- /
- Leisure
- /
- NasdaqGS:MAT
Mattel (MAT): Evaluating Valuation After Earnings Miss and Management’s Updated Outlook

Simply Wall St
Reviewed by Simply Wall St
Mattel (MAT) recently reported its third-quarter results, missing expectations on both revenue and profit as tariff challenges weighed on North American sales. Investor attention quickly shifted to the company’s outlook and management’s response.
See our latest analysis for Mattel.
Despite the dip after earnings, Mattel’s 1-month share price return of 5.05% and 90-day climb of 7.74% suggest momentum has not faded just yet. While short-term swings reflect shifting risk perceptions, Mattel’s 1-year total shareholder return of 3.59% points to steady, if unspectacular, long-term gains as the company navigates tariff-related headwinds and a recent $600 million bond deal.
If you’re curious about what other names are gaining traction, now is a great time to see what’s out there and discover fast growing stocks with high insider ownership
With shares still trading nearly 24% below analyst targets and fundamentals described as healthy by management, investors have to ask whether this is a rare buying opportunity or if the market is already pricing in all future upside.
Price-to-Earnings of 13.9x: Is it justified?
Mattel trades at a price-to-earnings multiple of 13.9x, based on its last closing price of $19.34. This benchmark sets the stage for a valuation discussion about whether the market is undervaluing or overvaluing Mattel compared to its peers and its own fundamentals.
The price-to-earnings (P/E) ratio measures the market’s expectations of a company’s earnings potential by comparing its current share price to its per-share earnings. For a company like Mattel, this ratio can reveal whether investors are paying a premium for future growth or if the price suggests caution around prospects and profitability.
At 13.9x, Mattel’s P/E ratio is lower than the global Leisure industry average of 20.7x. This suggests that, relative to peers, the market is not pricing in significant growth for Mattel or is factoring in recent earnings challenges. However, compared to its estimated fair P/E ratio of 15.1x, Mattel currently trades at a discount, indicating potential upside if market perceptions improve or performance rebounds.
Explore the SWS fair ratio for Mattel
Result: Price-to-Earnings of 13.9x (UNDERVALUED)
However, persistent tariff pressures and volatile North American sales trends could challenge Mattel’s momentum and limit upside if conditions unexpectedly worsen.
Find out about the key risks to this Mattel narrative.
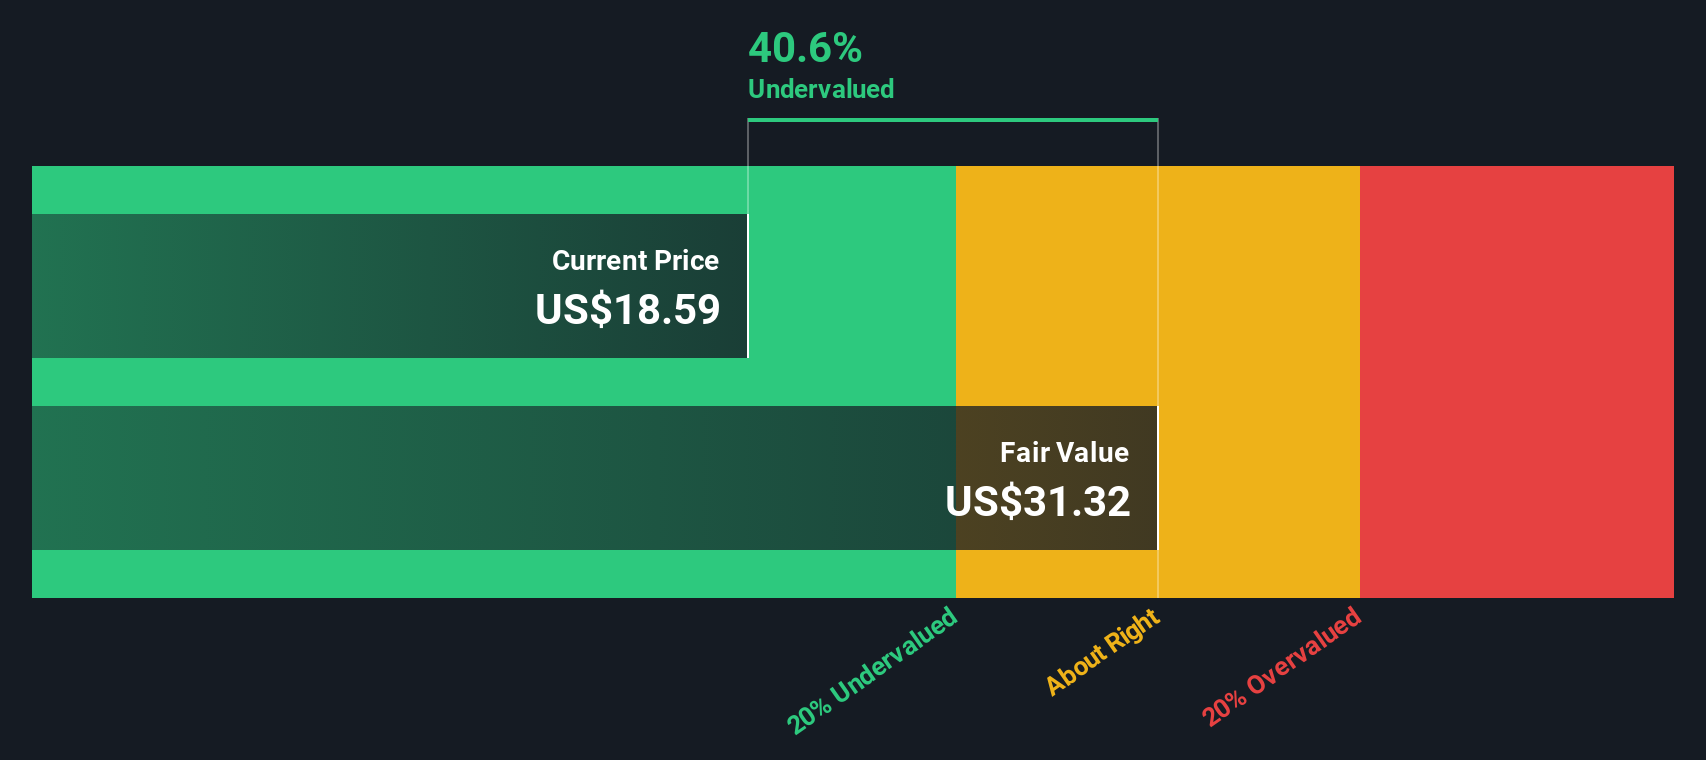
Another View: Discounted Cash Flow Perspective
Looking through the lens of our DCF model paints a different picture. According to this method, Mattel’s shares are trading about 40% below their estimated fair value of $32.34. This suggests a much deeper undervaluation than what earnings multiples show. Does this mean the market is missing something, or are future growth risks weighing more heavily than the numbers suggest?
Look into how the SWS DCF model arrives at its fair value.
Simply Wall St performs a discounted cash flow (DCF) on every stock in the world every day (check out Mattel for example). We show the entire calculation in full. You can track the result in your watchlist or portfolio and be alerted when this changes, or use our stock screener to discover 886 undervalued stocks based on their cash flows. If you save a screener we even alert you when new companies match - so you never miss a potential opportunity.
Build Your Own Mattel Narrative
If you see the numbers differently or want to follow your own approach, building your personalized view only takes a few minutes. Do it your way
A great starting point for your Mattel research is our analysis highlighting 3 key rewards and 1 important warning sign that could impact your investment decision.
Looking for More Smart Investment Ideas?
Take your investing strategy to the next level by tapping into opportunities you might not have considered. See what’s possible before others catch on.
- Tap into strong, reliable payouts by checking out these 16 dividend stocks with yields > 3% with enduring yields above 3%.
- Ride the next wave of AI innovation by evaluating these 25 AI penny stocks that are shaking up tech with breakthrough artificial intelligence advancements.
- Uncover undervalued gems potentially set for a rebound. Jump in with these 886 undervalued stocks based on cash flows based on robust cash flow fundamentals.
This article by Simply Wall St is general in nature. We provide commentary based on historical data and analyst forecasts only using an unbiased methodology and our articles are not intended to be financial advice. It does not constitute a recommendation to buy or sell any stock, and does not take account of your objectives, or your financial situation. We aim to bring you long-term focused analysis driven by fundamental data. Note that our analysis may not factor in the latest price-sensitive company announcements or qualitative material. Simply Wall St has no position in any stocks mentioned.
New: Manage All Your Stock Portfolios in One Place
We've created the ultimate portfolio companion for stock investors, and it's free.
• Connect an unlimited number of Portfolios and see your total in one currency
• Be alerted to new Warning Signs or Risks via email or mobile
• Track the Fair Value of your stocks
Have feedback on this article? Concerned about the content? Get in touch with us directly. Alternatively, email editorial-team@simplywallst.com
About NasdaqGS:MAT
Mattel
A toy and family entertainment company, designs, manufactures, and markets toys and consumer products in North America, Latin America, Europe, the Middle East, Africa, and the Asia Pacific.
Undervalued with excellent balance sheet.
Similar Companies
Market Insights

Advertisement
Community Narratives
MINISO's fair value is projected at 26.69 with an anticipated PE ratio shift of 20x
Fair Value US$24.03|11.0% undervalued
BE
Community Contributor
Procter & Gamble: A Dividend Giant Facing Slowing Growth
Fair Value US$119.81|23.3% overvalued
AN
Community Contributor
Eli Lilly's Future Growth Driven by Tirzepatide and Favorable Market Conditions
Fair Value US$1.19k|13.8% undervalued
EA
Community Contributor