
Advertisement
- United States
- /
- Luxury
- /
- NasdaqGS:GIII
Is G-III Apparel Group, Ltd. (NASDAQ:GIII) Creating Value For Shareholders?

Want to participate in a short research study? Help shape the future of investing tools and you could win a $250 gift card!
Today we are going to look at G-III Apparel Group, Ltd. (NASDAQ:GIII) to see whether it might be an attractive investment prospect. Specifically, we're going to calculate its Return On Capital Employed (ROCE), in the hopes of getting some insight into the business.
Firstly, we'll go over how we calculate ROCE. Then we'll compare its ROCE to similar companies. Last but not least, we'll look at what impact its current liabilities have on its ROCE.
What is Return On Capital Employed (ROCE)?
ROCE is a metric for evaluating how much pre-tax income (in percentage terms) a company earns on the capital invested in its business. Generally speaking a higher ROCE is better. Overall, it is a valuable metric that has its flaws. Author Edwin Whiting says to be careful when comparing the ROCE of different businesses, since 'No two businesses are exactly alike.'
How Do You Calculate Return On Capital Employed?
Analysts use this formula to calculate return on capital employed:
Return on Capital Employed = Earnings Before Interest and Tax (EBIT) ÷ (Total Assets - Current Liabilities)
Or for G-III Apparel Group:
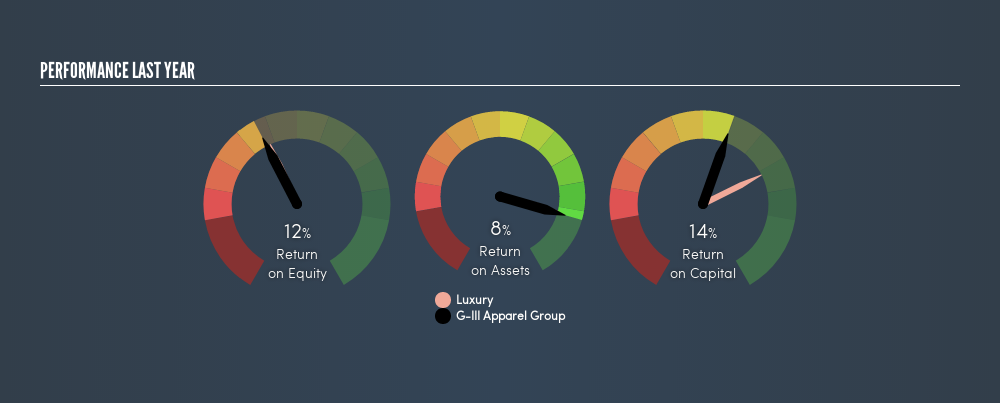
0.14 = US$234m ÷ (US$2.2b - US$581m) (Based on the trailing twelve months to January 2019.)
Therefore, G-III Apparel Group has an ROCE of 14%.
Check out our latest analysis for G-III Apparel Group
Does G-III Apparel Group Have A Good ROCE?
One way to assess ROCE is to compare similar companies. We can see G-III Apparel Group's ROCE is around the 14% average reported by the Luxury industry. Regardless of where G-III Apparel Group sits next to its industry, its ROCE in absolute terms appears satisfactory, and this company could be worth a closer look.
G-III Apparel Group's current ROCE of 14% is lower than its ROCE in the past, which was 20%, 3 years ago. This makes us wonder if the business is facing new challenges.
It is important to remember that ROCE shows past performance, and is not necessarily predictive. ROCE can be deceptive for cyclical businesses, as returns can look incredible in boom times, and terribly low in downturns. ROCE is only a point-in-time measure. Future performance is what matters, and you can see analyst predictions in our freereport on analyst forecasts for the company.
What Are Current Liabilities, And How Do They Affect G-III Apparel Group's ROCE?
Liabilities, such as supplier bills and bank overdrafts, are referred to as current liabilities if they need to be paid within 12 months. The ROCE equation subtracts current liabilities from capital employed, so a company with a lot of current liabilities appears to have less capital employed, and a higher ROCE than otherwise. To check the impact of this, we calculate if a company has high current liabilities relative to its total assets.
G-III Apparel Group has total assets of US$2.2b and current liabilities of US$581m. Therefore its current liabilities are equivalent to approximately 26% of its total assets. Current liabilities are minimal, limiting the impact on ROCE.
Our Take On G-III Apparel Group's ROCE
With that in mind, G-III Apparel Group's ROCE appears pretty good. G-III Apparel Group shapes up well under this analysis, but it is far from the only business delivering excellent numbers . You might also want to check this freecollection of companies delivering excellent earnings growth.
For those who like to find winning investments this freelist of growing companies with recent insider purchasing, could be just the ticket.
We aim to bring you long-term focused research analysis driven by fundamental data. Note that our analysis may not factor in the latest price-sensitive company announcements or qualitative material.
If you spot an error that warrants correction, please contact the editor at editorial-team@simplywallst.com. This article by Simply Wall St is general in nature. It does not constitute a recommendation to buy or sell any stock, and does not take account of your objectives, or your financial situation. Simply Wall St has no position in the stocks mentioned. Thank you for reading.
About NasdaqGS:GIII
G-III Apparel Group
Designs, sources, distributes, and markets women’s and men’s apparel in the United States and internationally.
Flawless balance sheet with solid track record.
Similar Companies
Market Insights


Advertisement
Community Narratives
The Future of Drug Testing? Fingerprint Tech Shows Serious Promise
Fair Value US$2.98|40.3% undervalued
JO
Community Contributor
Suncorp’s Next Chapter: Insurance-Only and Ready to Grow
Fair Value AU$22.83|7.9% undervalued
RO
Community Contributor
Thyssenkrupp Nucera Will Achieve Double-Digit Profits by 2030 Boosted by Hydrogen Growth
Fair Value €14.40|31.6% undervalued
CH
Community Contributor
Tesla’s Nvidia Moment – The AI & Robotics Inflection Point
Fair Value US$359.72|12.3% undervalued
BL
Community Contributor