
Advertisement
- United States
- /
- Electronic Equipment and Components
- /
- NasdaqCM:FORD
Here's What Forward Industries, Inc.'s (NASDAQ:FORD) P/E Is Telling Us

This article is written for those who want to get better at using price to earnings ratios (P/E ratios). To keep it practical, we'll show how Forward Industries, Inc.'s (NASDAQ:FORD) P/E ratio could help you assess the value on offer. Forward Industries has a price to earnings ratio of 16.98, based on the last twelve months. That means that at current prices, buyers pay $16.98 for every $1 in trailing yearly profits.
Want to participate in a short research study? Help shape the future of investing tools and you could win a $250 gift card!
Check out our latest analysis for Forward Industries
How Do I Calculate A Price To Earnings Ratio?
The formula for price to earnings is:
Price to Earnings Ratio = Price per Share ÷ Earnings per Share (EPS)
Or for Forward Industries:
P/E of 16.98 = $1.44 ÷ $0.085 (Based on the trailing twelve months to December 2018.)
Is A High P/E Ratio Good?
A higher P/E ratio means that buyers have to pay a higher price for each $1 the company has earned over the last year. That is not a good or a bad thing per se, but a high P/E does imply buyers are optimistic about the future.
How Growth Rates Impact P/E Ratios
Probably the most important factor in determining what P/E a company trades on is the earnings growth. If earnings are growing quickly, then the 'E' in the equation will increase faster than it would otherwise. That means unless the share price increases, the P/E will reduce in a few years. And as that P/E ratio drops, the company will look cheap, unless its share price increases.
Forward Industries's 57% EPS improvement over the last year was like bamboo growth after rain; rapid and impressive. And earnings per share have improved by 32% annually, over the last three years. So you might say it really deserves to have an above-average P/E ratio.
Does Forward Industries Have A Relatively High Or Low P/E For Its Industry?
The P/E ratio indicates whether the market has higher or lower expectations of a company. You can see in the image below that the average P/E (16.7) for companies in the luxury industry is roughly the same as Forward Industries's P/E.
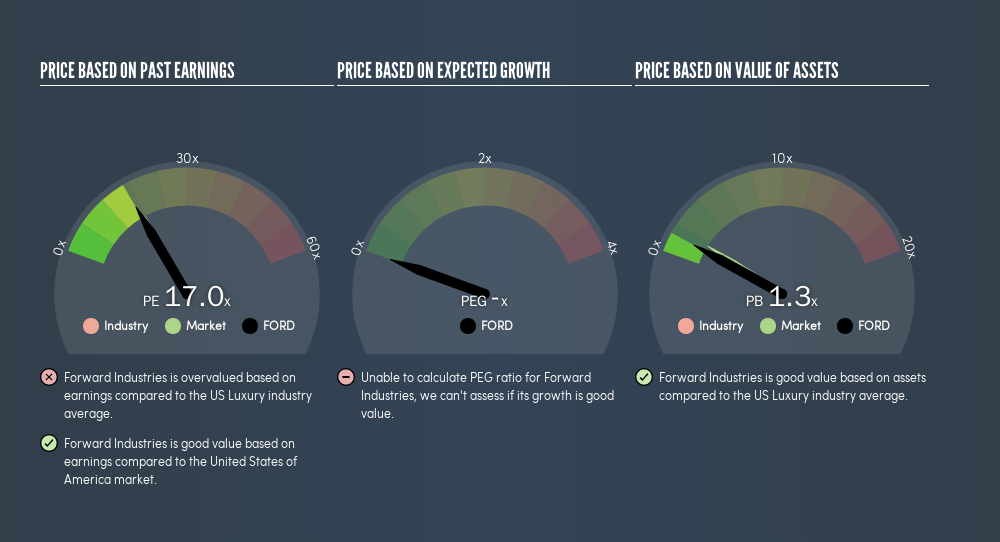
That indicates that the market expects Forward Industries will perform roughly in line with other companies in its industry. The company could surprise by performing better than average, in the future. Further research into factors such asmanagement tenure, could help you form your own view on whether that is likely.
A Limitation: P/E Ratios Ignore Debt and Cash In The Bank
It's important to note that the P/E ratio considers the market capitalization, not the enterprise value. Thus, the metric does not reflect cash or debt held by the company. Hypothetically, a company could reduce its future P/E ratio by spending its cash (or taking on debt) to achieve higher earnings.
Such spending might be good or bad, overall, but the key point here is that you need to look at debt to understand the P/E ratio in context.
Is Debt Impacting Forward Industries's P/E?
The extra options and safety that comes with Forward Industries's US$1.3m net cash position means that it deserves a higher P/E than it would if it had a lot of net debt.
The Verdict On Forward Industries's P/E Ratio
Forward Industries's P/E is 17 which is about average (17.9) in the US market. Its net cash position is the cherry on top of its superb EPS growth. So based on this analysis we'd expect Forward Industries to have a higher P/E ratio.
Investors should be looking to buy stocks that the market is wrong about. If it is underestimating a company, investors can make money by buying and holding the shares until the market corrects itself. Although we don't have analyst forecasts, you might want to assess this data-rich visualization of earnings, revenue and cash flow.
You might be able to find a better buy than Forward Industries. If you want a selection of possible winners, check out this free list of interesting companies that trade on a P/E below 20 (but have proven they can grow earnings).
We aim to bring you long-term focused research analysis driven by fundamental data. Note that our analysis may not factor in the latest price-sensitive company announcements or qualitative material.
If you spot an error that warrants correction, please contact the editor at editorial-team@simplywallst.com. This article by Simply Wall St is general in nature. It does not constitute a recommendation to buy or sell any stock, and does not take account of your objectives, or your financial situation. Simply Wall St has no position in the stocks mentioned. Thank you for reading.
About NasdaqCM:FORD
Forward Industries
Designs, manufactures, sources, markets, and distributes carry and protective solutions.
Flawless balance sheet low.
Similar Companies
Market Insights


Advertisement
Community Narratives
For the Emperor: Why Games Workshop Could Be a Star Investment
Fair Value UK£160.00|0.5% overvalued
RO
Community Contributor
Securitas will boost margins with AI and tech-driven services
Fair Value SEK 260.91|44.9% undervalued
UN
Community Contributor
A Leader in EV Charging with Growth Potential
Fair Value €27.00|21.3% undervalued
TI
Community Contributor