- United States
- /
- Commercial Services
- /
- NYSE:VLTO
Calculating The Fair Value Of Veralto Corporation (NYSE:VLTO)


Key Insights
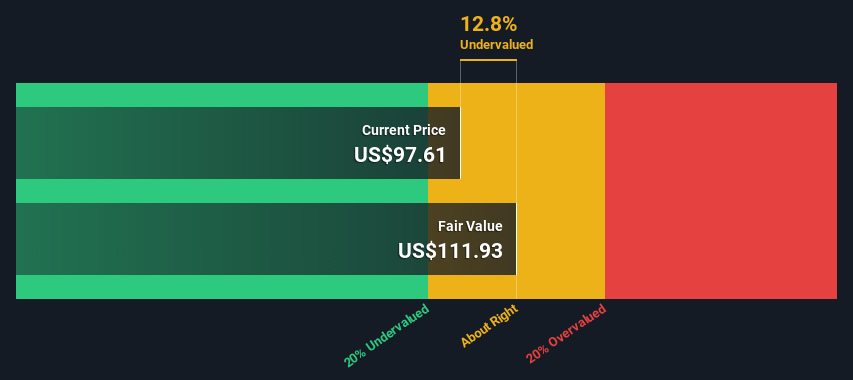
- The projected fair value for Veralto is US$112 based on 2 Stage Free Cash Flow to Equity
- Veralto's US$97.61 share price indicates it is trading at similar levels as its fair value estimate
- Analyst price target for VLTO is US$100 which is 11% below our fair value estimate
Today we will run through one way of estimating the intrinsic value of Veralto Corporation (NYSE:VLTO) by estimating the company's future cash flows and discounting them to their present value. This will be done using the Discounted Cash Flow (DCF) model. There's really not all that much to it, even though it might appear quite complex.
Remember though, that there are many ways to estimate a company's value, and a DCF is just one method. If you want to learn more about discounted cash flow, the rationale behind this calculation can be read in detail in the Simply Wall St analysis model.
Check out our latest analysis for Veralto
The Calculation
We're using the 2-stage growth model, which simply means we take in account two stages of company's growth. In the initial period the company may have a higher growth rate and the second stage is usually assumed to have a stable growth rate. To start off with, we need to estimate the next ten years of cash flows. Where possible we use analyst estimates, but when these aren't available we extrapolate the previous free cash flow (FCF) from the last estimate or reported value. We assume companies with shrinking free cash flow will slow their rate of shrinkage, and that companies with growing free cash flow will see their growth rate slow, over this period. We do this to reflect that growth tends to slow more in the early years than it does in later years.
A DCF is all about the idea that a dollar in the future is less valuable than a dollar today, and so the sum of these future cash flows is then discounted to today's value:
10-year free cash flow (FCF) estimate
| 2024 | 2025 | 2026 | 2027 | 2028 | 2029 | 2030 | 2031 | 2032 | 2033 | |
| Levered FCF ($, Millions) | US$830.8m | US$930.7m | US$1.04b | US$1.11b | US$1.24b | US$1.33b | US$1.40b | US$1.47b | US$1.53b | US$1.58b |
| Growth Rate Estimate Source | Analyst x8 | Analyst x8 | Analyst x7 | Analyst x2 | Analyst x1 | Est @ 7.13% | Est @ 5.71% | Est @ 4.71% | Est @ 4.01% | Est @ 3.52% |
| Present Value ($, Millions) Discounted @ 6.8% | US$778 | US$816 | US$857 | US$856 | US$892 | US$895 | US$886 | US$869 | US$846 | US$821 |
("Est" = FCF growth rate estimated by Simply Wall St)
Present Value of 10-year Cash Flow (PVCF) = US$8.5b
The second stage is also known as Terminal Value, this is the business's cash flow after the first stage. The Gordon Growth formula is used to calculate Terminal Value at a future annual growth rate equal to the 5-year average of the 10-year government bond yield of 2.4%. We discount the terminal cash flows to today's value at a cost of equity of 6.8%.
Terminal Value (TV)= FCF2033 × (1 + g) ÷ (r – g) = US$1.6b× (1 + 2.4%) ÷ (6.8%– 2.4%) = US$37b
Present Value of Terminal Value (PVTV)= TV / (1 + r)10= US$37b÷ ( 1 + 6.8%)10= US$19b
The total value is the sum of cash flows for the next ten years plus the discounted terminal value, which results in the Total Equity Value, which in this case is US$28b. In the final step we divide the equity value by the number of shares outstanding. Compared to the current share price of US$97.6, the company appears about fair value at a 13% discount to where the stock price trades currently. The assumptions in any calculation have a big impact on the valuation, so it is better to view this as a rough estimate, not precise down to the last cent.
Important Assumptions
The calculation above is very dependent on two assumptions. The first is the discount rate and the other is the cash flows. If you don't agree with these result, have a go at the calculation yourself and play with the assumptions. The DCF also does not consider the possible cyclicality of an industry, or a company's future capital requirements, so it does not give a full picture of a company's potential performance. Given that we are looking at Veralto as potential shareholders, the cost of equity is used as the discount rate, rather than the cost of capital (or weighted average cost of capital, WACC) which accounts for debt. In this calculation we've used 6.8%, which is based on a levered beta of 0.955. Beta is a measure of a stock's volatility, compared to the market as a whole. We get our beta from the industry average beta of globally comparable companies, with an imposed limit between 0.8 and 2.0, which is a reasonable range for a stable business.
SWOT Analysis for Veralto
- Debt is well covered by earnings and cashflows.
- Earnings declined over the past year.
- Dividend is low compared to the top 25% of dividend payers in the Commercial Services market.
- Annual earnings are forecast to grow for the next 3 years.
- Current share price is below our estimate of fair value.
- Annual earnings are forecast to grow slower than the American market.
Moving On:
Although the valuation of a company is important, it is only one of many factors that you need to assess for a company. It's not possible to obtain a foolproof valuation with a DCF model. Rather it should be seen as a guide to "what assumptions need to be true for this stock to be under/overvalued?" If a company grows at a different rate, or if its cost of equity or risk free rate changes sharply, the output can look very different. For Veralto, there are three relevant items you should look at:
- Risks: Take risks, for example - Veralto has 1 warning sign we think you should be aware of.
- Management:Have insiders been ramping up their shares to take advantage of the market's sentiment for VLTO's future outlook? Check out our management and board analysis with insights on CEO compensation and governance factors.
- Other High Quality Alternatives: Do you like a good all-rounder? Explore our interactive list of high quality stocks to get an idea of what else is out there you may be missing!
PS. Simply Wall St updates its DCF calculation for every American stock every day, so if you want to find the intrinsic value of any other stock just search here.
If you're looking to trade Veralto, open an account with the lowest-cost platform trusted by professionals, Interactive Brokers.
With clients in over 200 countries and territories, and access to 160 markets, IBKR lets you trade stocks, options, futures, forex, bonds and funds from a single integrated account.
Enjoy no hidden fees, no account minimums, and FX conversion rates as low as 0.03%, far better than what most brokers offer.
Sponsored ContentNew: Manage All Your Stock Portfolios in One Place
We've created the ultimate portfolio companion for stock investors, and it's free.
• Connect an unlimited number of Portfolios and see your total in one currency
• Be alerted to new Warning Signs or Risks via email or mobile
• Track the Fair Value of your stocks
Have feedback on this article? Concerned about the content? Get in touch with us directly. Alternatively, email editorial-team (at) simplywallst.com.
This article by Simply Wall St is general in nature. We provide commentary based on historical data and analyst forecasts only using an unbiased methodology and our articles are not intended to be financial advice. It does not constitute a recommendation to buy or sell any stock, and does not take account of your objectives, or your financial situation. We aim to bring you long-term focused analysis driven by fundamental data. Note that our analysis may not factor in the latest price-sensitive company announcements or qualitative material. Simply Wall St has no position in any stocks mentioned.
Have feedback on this article? Concerned about the content? Get in touch with us directly. Alternatively, email editorial-team@simplywallst.com
About NYSE:VLTO
Veralto
Provides water analytics, water treatment, marking and coding, and packaging and color solutions worldwide.
Solid track record and good value.
Similar Companies
Market Insights

Community Narratives

