Advertisement
- United States
- /
- Commercial Services
- /
- NYSE:SCS
Does Steelcase’s 47.6% Rally in 2025 Signal Room for More Gains?

Simply Wall St
Reviewed by Bailey Pemberton
If you’ve been watching Steelcase stock lately, you’re not alone. Whether you’re wondering if now is the time to buy, hold, or cash in some gains, there’s plenty to consider. After notching a 0.7% gain in just the last week, and more than doubling investors’ money over the past three years with a 171.5% return, Steelcase has certainly caught the market’s attention. That momentum is not just a blip; with a 47.6% gain year-to-date, the company’s upward move reflects both a renewed sense of potential in the workspace sector and a shift in how investors view risk in this part of the market.
Of course, price moves only tell half the story. The real question is whether these gains are justified, or if the stock is running ahead of its true value. To help answer that, we’ve crunched the numbers using six distinct valuation checks, and Steelcase scores a solid 4 out of 6 for being undervalued. That score means it passes most of the hurdles that matter to value-seekers, but not all.
Let’s dig in to how those valuation approaches assess Steelcase’s worth, and why there may be an even smarter way to look at its true value by the end of this analysis.
Approach 1: Steelcase Discounted Cash Flow (DCF) Analysis
A Discounted Cash Flow (DCF) model estimates a company's value by projecting its future cash flows and discounting those amounts back to today's dollars. This helps investors gauge what a business is really worth, based on its underlying ability to generate cash well into the future.
For Steelcase, the current Free Cash Flow stands at -$35.61 million, reflecting a recent period of negative cash generation. However, analysts anticipate a significant turnaround. By 2027, projected Free Cash Flow is $193.3 million, with consistent annual growth applied to estimate longer-term performance. Over the next decade, Simply Wall St extrapolates these trends. Discounted future cash flows could climb as high as $139.39 million by 2035.
Running these figures through the DCF model yields an intrinsic fair value estimate of $40.98 per share. Compared to the current market price, this indicates the stock is trading at a 58.0% discount to its calculated worth. This suggests Steelcase is significantly undervalued according to this cash flow-based approach.
Result: UNDERVALUED
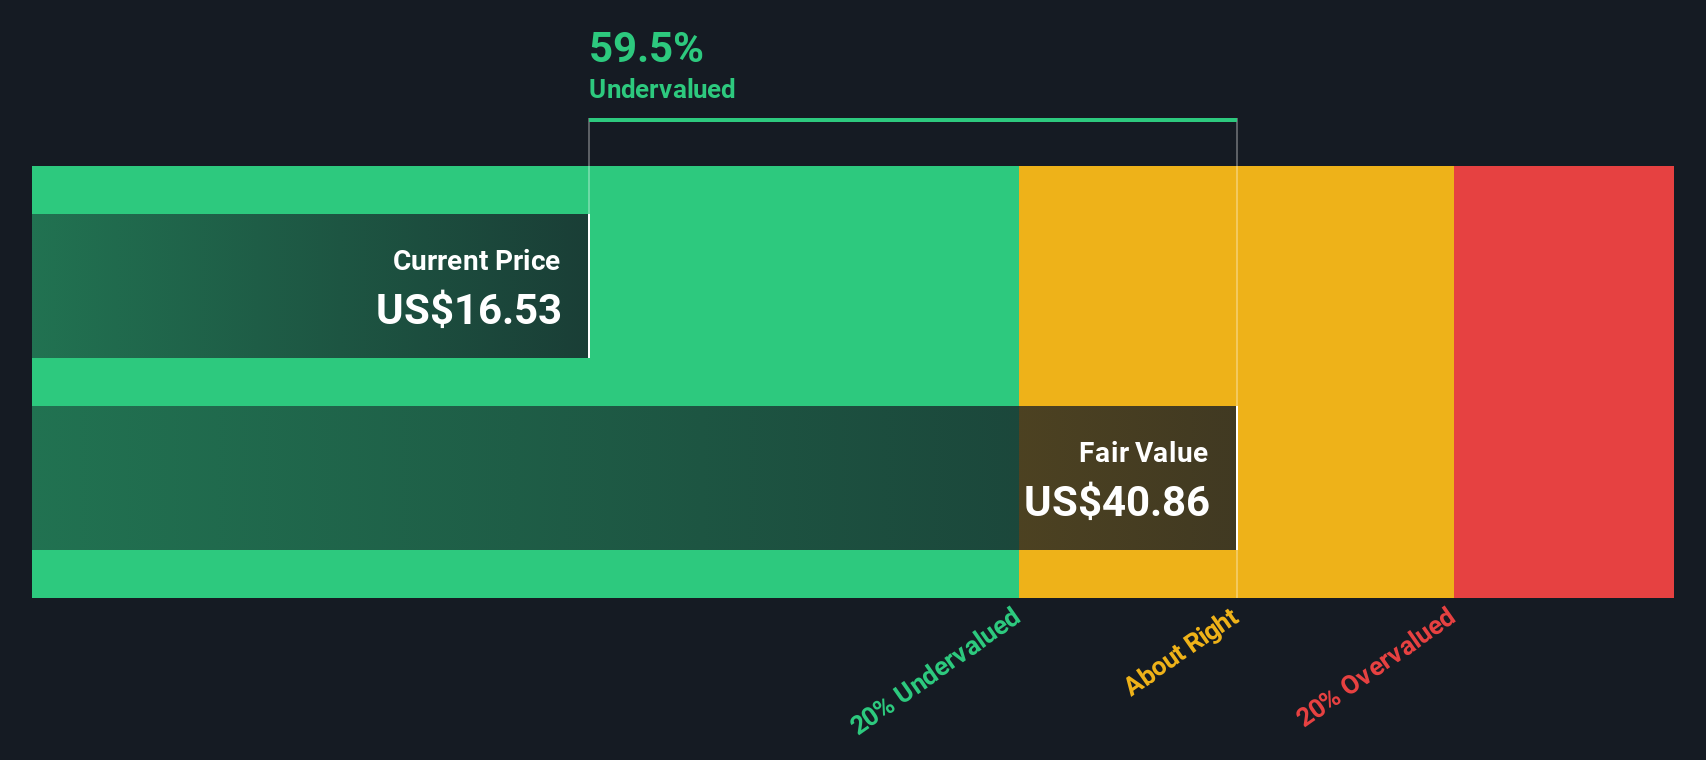
Our Discounted Cash Flow (DCF) analysis suggests Steelcase is undervalued by 58.0%. Track this in your watchlist or portfolio, or discover more undervalued stocks.
Approach 2: Steelcase Price vs Earnings
The Price-to-Earnings (PE) ratio is a widely used method for valuing profitable companies, as it compares a company's current share price to its earnings per share. This metric gives investors a straightforward way to understand how much they’re paying for each dollar of earnings, making it especially useful for companies like Steelcase that are generating consistent profits.
What counts as a “normal” or “fair” PE ratio depends not just on earnings, but also on growth expectations and risk. Companies expected to grow faster, or with less risk, often command a higher PE, while those with uncertain prospects or more volatility tend to trade at lower multiples.
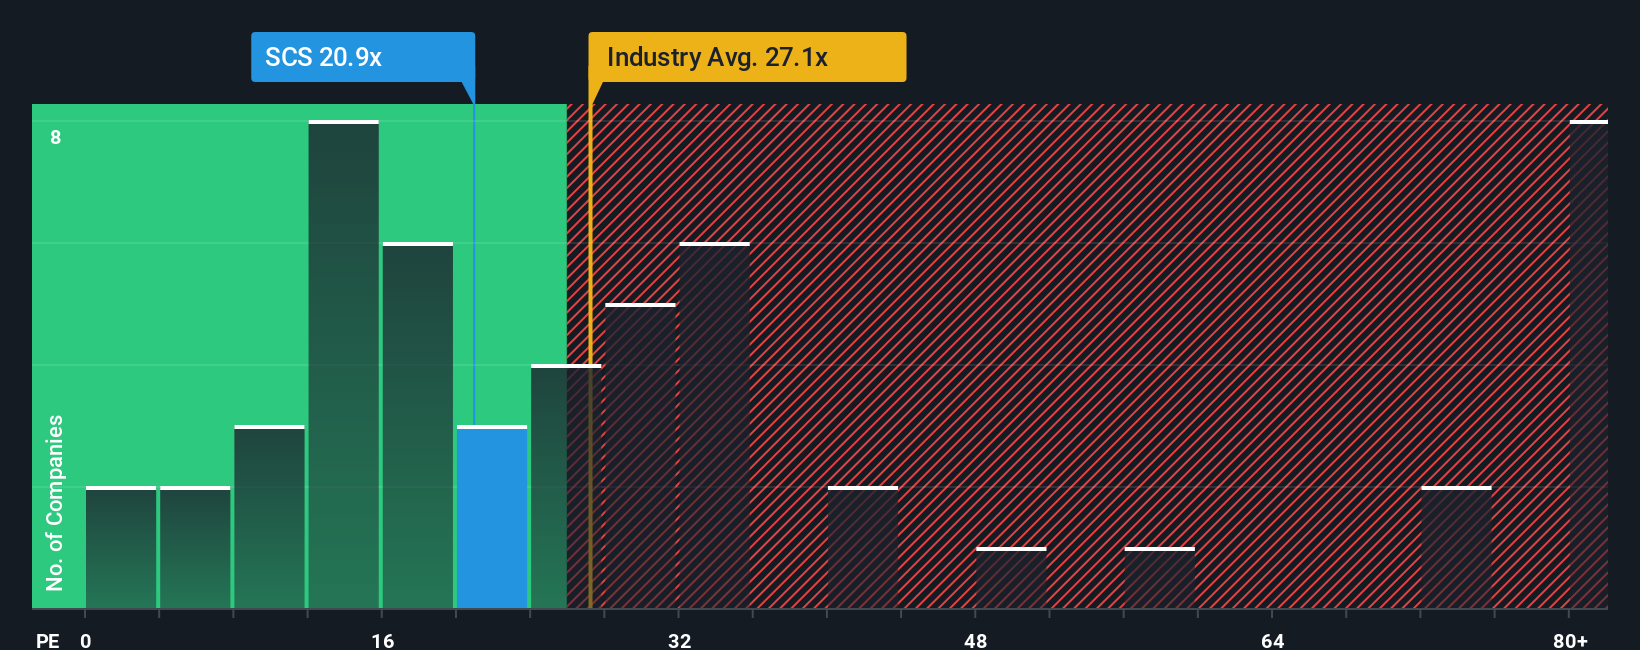
Right now, Steelcase trades at a PE multiple of 21.5x. This sits above its peer average of 17.3x, but below the Commercial Services industry average of 29.8x. These comparisons can be helpful, but they do not always tell the full story. That is where Simply Wall St’s proprietary “Fair Ratio” comes in, providing a 31.7x PE for Steelcase. The Fair Ratio considers the company’s growth prospects, profit margins, industry trends, market cap, and unique risk profile, delivering a more tailored benchmark than a simple peer or sector average.
Since Steelcase’s current 21.5x PE is well below its Fair Ratio of 31.7x, this approach suggests the stock is undervalued relative to where it should trade, given its complete risk and growth profile.
Result: UNDERVALUED
PE ratios tell one story, but what if the real opportunity lies elsewhere? Discover companies where insiders are betting big on explosive growth.
Upgrade Your Decision Making: Choose your Steelcase Narrative
Earlier we mentioned that there is an even better way to understand valuation, so let’s introduce you to Narratives. A Narrative is simply your investment story, combining your own assumptions about Steelcase's future, such as expected revenue growth, earnings, and margins, with your fair value estimate. It connects the company’s business outlook with financial forecasts and results in a personalized assessment of what the stock is truly worth.
On Simply Wall St’s Community page, used by millions of investors, Narratives make this process accessible to everyone. They help you decide whether to buy, sell, or hold by instantly comparing your fair value to the current share price, giving you a transparent basis for each investment decision. Best of all, Narratives are updated in real-time, so if news or earnings reports change the outlook, your Narrative (and fair value) is automatically refreshed.
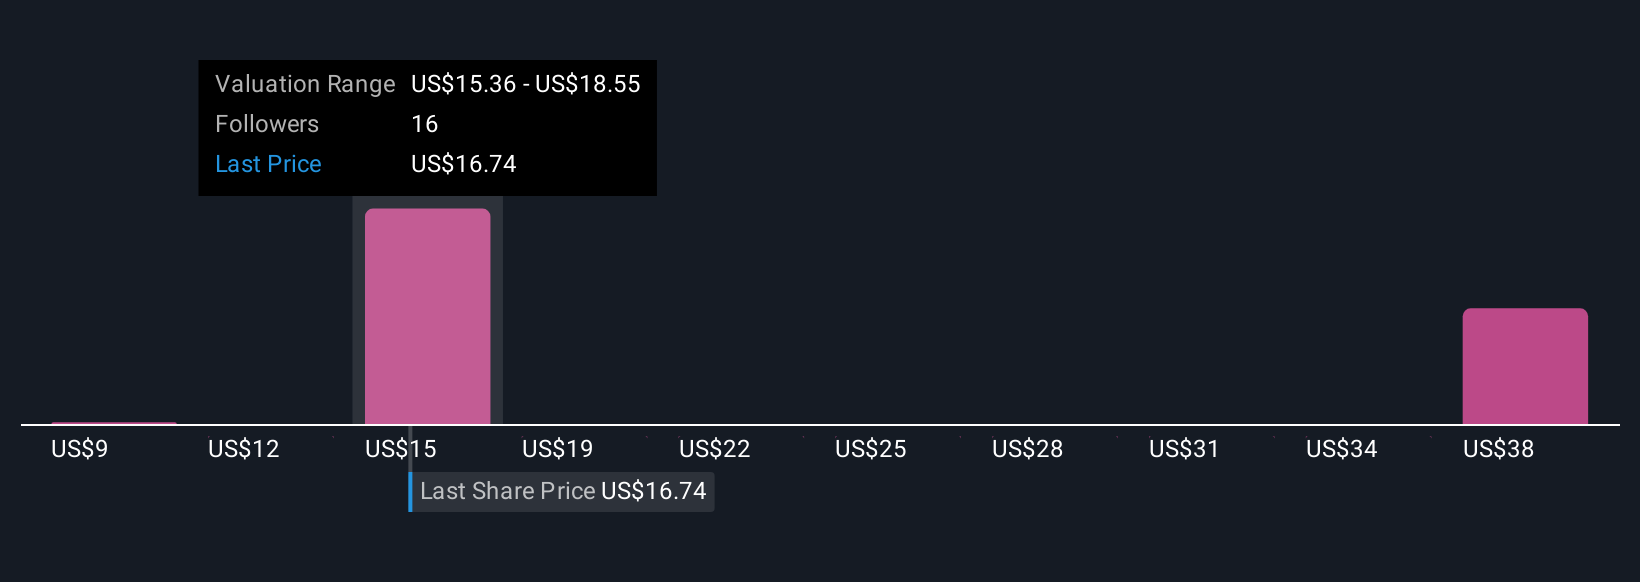
For example, one Steelcase investor might see robust workspace demand and forecast a fair value as high as $18.00 per share, while a more cautious perspective focused on industry headwinds might land closer to $15.00 per share, highlighting how Narratives reflect the real diversity of informed opinions.
Do you think there's more to the story for Steelcase? Create your own Narrative to let the Community know!
This article by Simply Wall St is general in nature. We provide commentary based on historical data and analyst forecasts only using an unbiased methodology and our articles are not intended to be financial advice. It does not constitute a recommendation to buy or sell any stock, and does not take account of your objectives, or your financial situation. We aim to bring you long-term focused analysis driven by fundamental data. Note that our analysis may not factor in the latest price-sensitive company announcements or qualitative material. Simply Wall St has no position in any stocks mentioned.
New: Manage All Your Stock Portfolios in One Place
We've created the ultimate portfolio companion for stock investors, and it's free.
• Connect an unlimited number of Portfolios and see your total in one currency
• Be alerted to new Warning Signs or Risks via email or mobile
• Track the Fair Value of your stocks
Have feedback on this article? Concerned about the content? Get in touch with us directly. Alternatively, email editorial-team@simplywallst.com
About NYSE:SCS
Steelcase
Provides a portfolio of furniture and architectural products and services in the United States and internationally.
Excellent balance sheet and good value.
Similar Companies
Market Insights

Advertisement
Community Narratives
The Next Phase of Energy Storage: How NeoVolta Is Tackling America’s Power Crunch
Fair Value US$7.50|35.1% undervalued
MA
Community Contributor
Why EnSilica is Worth Possibly 13x its Current Price
Fair Value UK£5.00|89.8% undervalued
DO
Community Contributor
M&A Activity, Industry Diversification & A Defense Contract Monopoly Will Push BWXT For Healthy Long-Term Growth
Fair Value US$220.00|15.2% undervalued
CL
Community Contributor
A case for Cassiar Gold Corp (TSXV: GLDC) to reach CAD$8-10 before 2030 (X30-37)
Fair Value CA$10.00|96.0% undervalued
AG
Community Contributor