- United States
- /
- Commercial Services
- /
- NYSE:MSA
Calculating The Fair Value Of MSA Safety Incorporated (NYSE:MSA)


Key Insights
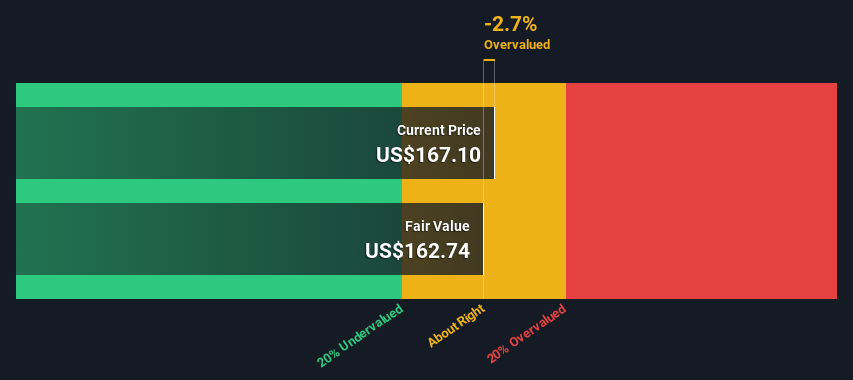
- Using the 2 Stage Free Cash Flow to Equity, MSA Safety fair value estimate is US$163
- MSA Safety's US$167 share price indicates it is trading at similar levels as its fair value estimate
- Our fair value estimate is 13% lower than MSA Safety's analyst price target of US$188
Today we'll do a simple run through of a valuation method used to estimate the attractiveness of MSA Safety Incorporated (NYSE:MSA) as an investment opportunity by taking the expected future cash flows and discounting them to today's value. One way to achieve this is by employing the Discounted Cash Flow (DCF) model. Models like these may appear beyond the comprehension of a lay person, but they're fairly easy to follow.
Remember though, that there are many ways to estimate a company's value, and a DCF is just one method. If you want to learn more about discounted cash flow, the rationale behind this calculation can be read in detail in the Simply Wall St analysis model.
Check out our latest analysis for MSA Safety
The Method
We are going to use a two-stage DCF model, which, as the name states, takes into account two stages of growth. The first stage is generally a higher growth period which levels off heading towards the terminal value, captured in the second 'steady growth' period. To begin with, we have to get estimates of the next ten years of cash flows. Where possible we use analyst estimates, but when these aren't available we extrapolate the previous free cash flow (FCF) from the last estimate or reported value. We assume companies with shrinking free cash flow will slow their rate of shrinkage, and that companies with growing free cash flow will see their growth rate slow, over this period. We do this to reflect that growth tends to slow more in the early years than it does in later years.
A DCF is all about the idea that a dollar in the future is less valuable than a dollar today, and so the sum of these future cash flows is then discounted to today's value:
10-year free cash flow (FCF) forecast
| 2024 | 2025 | 2026 | 2027 | 2028 | 2029 | 2030 | 2031 | 2032 | 2033 | |
| Levered FCF ($, Millions) | US$223.6m | US$255.8m | US$279.7m | US$299.9m | US$317.0m | US$331.8m | US$344.8m | US$356.6m | US$367.5m | US$377.8m |
| Growth Rate Estimate Source | Analyst x1 | Analyst x1 | Est @ 9.34% | Est @ 7.21% | Est @ 5.71% | Est @ 4.66% | Est @ 3.93% | Est @ 3.42% | Est @ 3.06% | Est @ 2.81% |
| Present Value ($, Millions) Discounted @ 6.9% | US$209 | US$224 | US$229 | US$230 | US$227 | US$222 | US$216 | US$209 | US$202 | US$194 |
("Est" = FCF growth rate estimated by Simply Wall St)
Present Value of 10-year Cash Flow (PVCF) = US$2.2b
After calculating the present value of future cash flows in the initial 10-year period, we need to calculate the Terminal Value, which accounts for all future cash flows beyond the first stage. For a number of reasons a very conservative growth rate is used that cannot exceed that of a country's GDP growth. In this case we have used the 5-year average of the 10-year government bond yield (2.2%) to estimate future growth. In the same way as with the 10-year 'growth' period, we discount future cash flows to today's value, using a cost of equity of 6.9%.
Terminal Value (TV)= FCF2033 × (1 + g) ÷ (r – g) = US$378m× (1 + 2.2%) ÷ (6.9%– 2.2%) = US$8.3b
Present Value of Terminal Value (PVTV)= TV / (1 + r)10= US$8.3b÷ ( 1 + 6.9%)10= US$4.2b
The total value is the sum of cash flows for the next ten years plus the discounted terminal value, which results in the Total Equity Value, which in this case is US$6.4b. To get the intrinsic value per share, we divide this by the total number of shares outstanding. Relative to the current share price of US$167, the company appears around fair value at the time of writing. The assumptions in any calculation have a big impact on the valuation, so it is better to view this as a rough estimate, not precise down to the last cent.
The Assumptions
We would point out that the most important inputs to a discounted cash flow are the discount rate and of course the actual cash flows. If you don't agree with these result, have a go at the calculation yourself and play with the assumptions. The DCF also does not consider the possible cyclicality of an industry, or a company's future capital requirements, so it does not give a full picture of a company's potential performance. Given that we are looking at MSA Safety as potential shareholders, the cost of equity is used as the discount rate, rather than the cost of capital (or weighted average cost of capital, WACC) which accounts for debt. In this calculation we've used 6.9%, which is based on a levered beta of 0.936. Beta is a measure of a stock's volatility, compared to the market as a whole. We get our beta from the industry average beta of globally comparable companies, with an imposed limit between 0.8 and 2.0, which is a reasonable range for a stable business.
SWOT Analysis for MSA Safety
- Debt is well covered by earnings.
- Earnings declined over the past year.
- Dividend is low compared to the top 25% of dividend payers in the Commercial Services market.
- Expensive based on P/S ratio and estimated fair value.
- Annual earnings are forecast to grow faster than the American market.
- Debt is not well covered by operating cash flow.
- Dividends are not covered by earnings.
- Annual revenue is forecast to grow slower than the American market.
Moving On:
Whilst important, the DCF calculation is only one of many factors that you need to assess for a company. The DCF model is not a perfect stock valuation tool. Preferably you'd apply different cases and assumptions and see how they would impact the company's valuation. If a company grows at a different rate, or if its cost of equity or risk free rate changes sharply, the output can look very different. For MSA Safety, there are three relevant factors you should consider:
- Risks: To that end, you should learn about the 3 warning signs we've spotted with MSA Safety (including 1 which is significant) .
- Future Earnings: How does MSA's growth rate compare to its peers and the wider market? Dig deeper into the analyst consensus number for the upcoming years by interacting with our free analyst growth expectation chart.
- Other Solid Businesses: Low debt, high returns on equity and good past performance are fundamental to a strong business. Why not explore our interactive list of stocks with solid business fundamentals to see if there are other companies you may not have considered!
PS. Simply Wall St updates its DCF calculation for every American stock every day, so if you want to find the intrinsic value of any other stock just search here.
New: Manage All Your Stock Portfolios in One Place
We've created the ultimate portfolio companion for stock investors, and it's free.
• Connect an unlimited number of Portfolios and see your total in one currency
• Be alerted to new Warning Signs or Risks via email or mobile
• Track the Fair Value of your stocks
Have feedback on this article? Concerned about the content? Get in touch with us directly. Alternatively, email editorial-team (at) simplywallst.com.
This article by Simply Wall St is general in nature. We provide commentary based on historical data and analyst forecasts only using an unbiased methodology and our articles are not intended to be financial advice. It does not constitute a recommendation to buy or sell any stock, and does not take account of your objectives, or your financial situation. We aim to bring you long-term focused analysis driven by fundamental data. Note that our analysis may not factor in the latest price-sensitive company announcements or qualitative material. Simply Wall St has no position in any stocks mentioned.
About NYSE:MSA
MSA Safety
Develops, manufactures, and supplies safety products and technology solutions that protect people and facility infrastructures in the fire service, energy, utility, construction, and industrial manufacturing applications, as well as heating, ventilation, air conditioning, and refrigeration industries worldwide.
Outstanding track record with flawless balance sheet and pays a dividend.

