Advertisement
- United States
- /
- Professional Services
- /
- NYSE:MMS
Assessing Maximus After Strong 12.4% Rally and Positive Industry Momentum in 2025

Simply Wall St
Reviewed by Bailey Pemberton
If you’re on the fence about Maximus, I get it. With so many moving parts in today’s market, deciding whether to stick, sell, or buy more is never simple. Over the past year, we’ve seen Maximus’s share price zigzag, dropping by 3.7% during a rocky patch, but then making up serious ground with a 12.4% jump year-to-date. If you zoom out further, the stock’s three-year return of 55.2% certainly turns some heads, and it’s still up an impressive 36.7% over the past five years.
Some of these moves mirror shifts in how investors weigh higher-for-longer interest rates, as well as renewed optimism in sectors linked to government outsourcing and health. Even with a mild dip this past week (down just 0.4%), there’s an undercurrent of confidence in Maximus’s long-term prospects, which keeps drawing attention from both retail and institutional investors.
But the big question stays the same: Is Maximus a bargain right now, or are the best gains already baked in? According to our six-point valuation checklist, Maximus scores a 5. That means by nearly every measure we use, the company appears undervalued. This can be an encouraging signal for anyone combing the market for quality at a discount. Let’s break down exactly where Maximus stacks up against different valuation yardsticks, and at the end, I’ll share an even deeper perspective on what really matters for long-term investors.
Approach 1: Maximus Discounted Cash Flow (DCF) Analysis
The Discounted Cash Flow (DCF) model estimates intrinsic value by projecting a company’s future free cash flows and discounting them back to today’s dollars. This approach provides a grounded estimate of what the business might truly be worth based on its expected ability to generate cash over time.
For Maximus, the DCF analysis uses a two-stage free cash flow to equity model and all estimates are presented in $. The company’s latest twelve months free cash flow stands at negative $160.8 million, though projections are for a strong turnaround. By 2027, analysts expect Maximus to generate about $408 million in free cash flow. Looking further out, using a mixture of analyst estimates and sensible long-term growth rates, Simply Wall St’s model extrapolates free cash flows reaching as high as $548 million by 2035.
Running these future cash projections through the model yields an intrinsic value of $160.14 per share. Compared to Maximus’s current share price, this implies the stock is trading at a 46.8% discount, suggesting meaningful upside for investors searching for value.
Result: UNDERVALUED
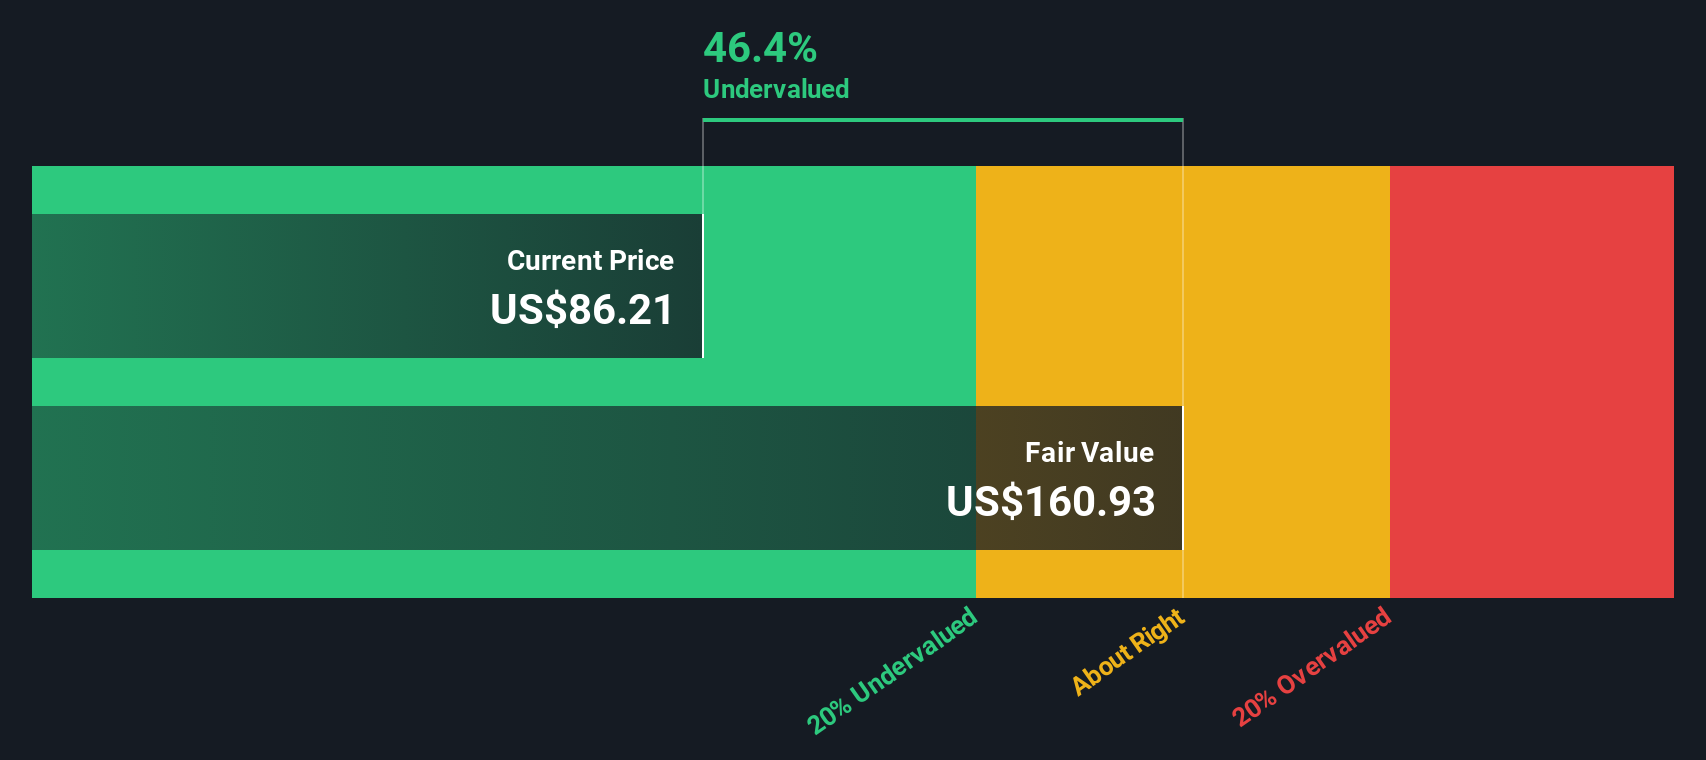
Our Discounted Cash Flow (DCF) analysis suggests Maximus is undervalued by 46.8%. Track this in your watchlist or portfolio, or discover more undervalued stocks.
Approach 2: Maximus Price vs Earnings
The Price-to-Earnings (PE) ratio is often the go-to valuation tool for established, profitable companies like Maximus. This multiple helps investors gauge what the market is willing to pay today for a dollar of current earnings, making it especially useful when a business is generating steady profits.
However, what’s considered a “normal” or “fair” PE ratio depends on a mix of factors, including growth expectations and overall business risk. Higher growth prospects and lower risk usually justify higher multiples, while more mature or riskier companies tend to trade at lower multiples.
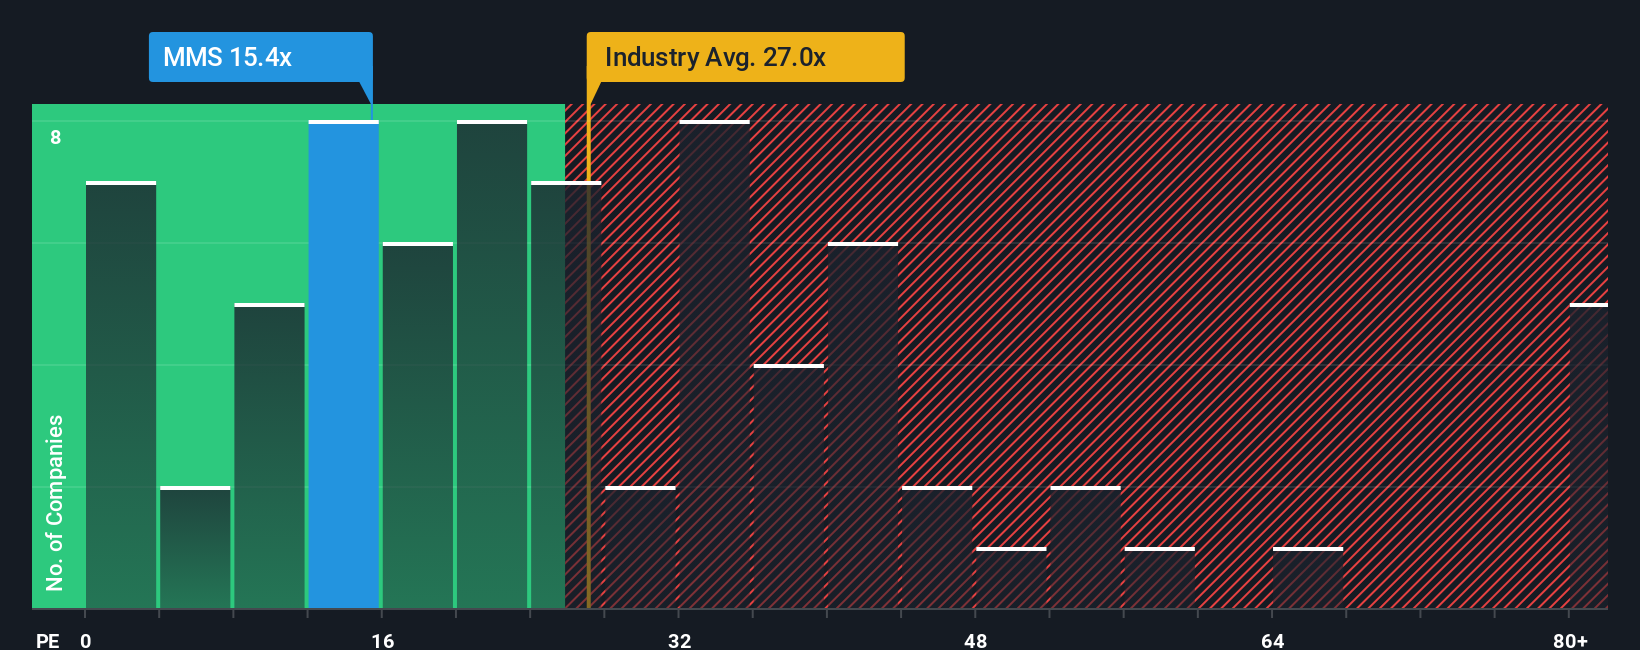
Maximus currently trades at a PE of 15.2x. To put this in perspective, the average for its Professional Services industry peers sits at 24.9x, with the closest comparable group at an even richer 34.8x. Simply Wall St also introduces a proprietary “Fair Ratio,” in this case 24.3x, tailored to Maximus’s specific earnings growth, profit margins, industry conditions, company size, and risk profile.
Unlike simple peer or industry comparisons, the Fair Ratio gives a more nuanced view by weighing all the relevant financial and business factors unique to Maximus. It is designed to answer the key question, “Given everything we know, what multiple does Maximus truly deserve?”
With a current PE of 15.2x and a Fair Ratio of 24.3x, Maximus appears materially undervalued by this measure, which may be an encouraging sign for value investors.
Result: UNDERVALUED
PE ratios tell one story, but what if the real opportunity lies elsewhere? Discover companies where insiders are betting big on explosive growth.
Upgrade Your Decision Making: Choose your Maximus Narrative
Earlier we mentioned there is an even better way to understand valuation, so let’s introduce you to Narratives, a dynamic, accessible method that brings the story behind a company to life alongside the numbers. A Narrative goes beyond the raw data by letting you attach your own view on Maximus’s future, including what you believe about its fair value, expected revenue growth, margins, and ongoing business changes.
On Simply Wall St’s Community page, millions of investors are already using Narratives as an easy tool to craft and update these stories, transforming headline numbers into actionable insights. Narratives connect a company’s real-world story to financial forecasts and then to a tailored fair value, helping you see not just what the market price is today, but what it could be based on your scenario or others in the community.
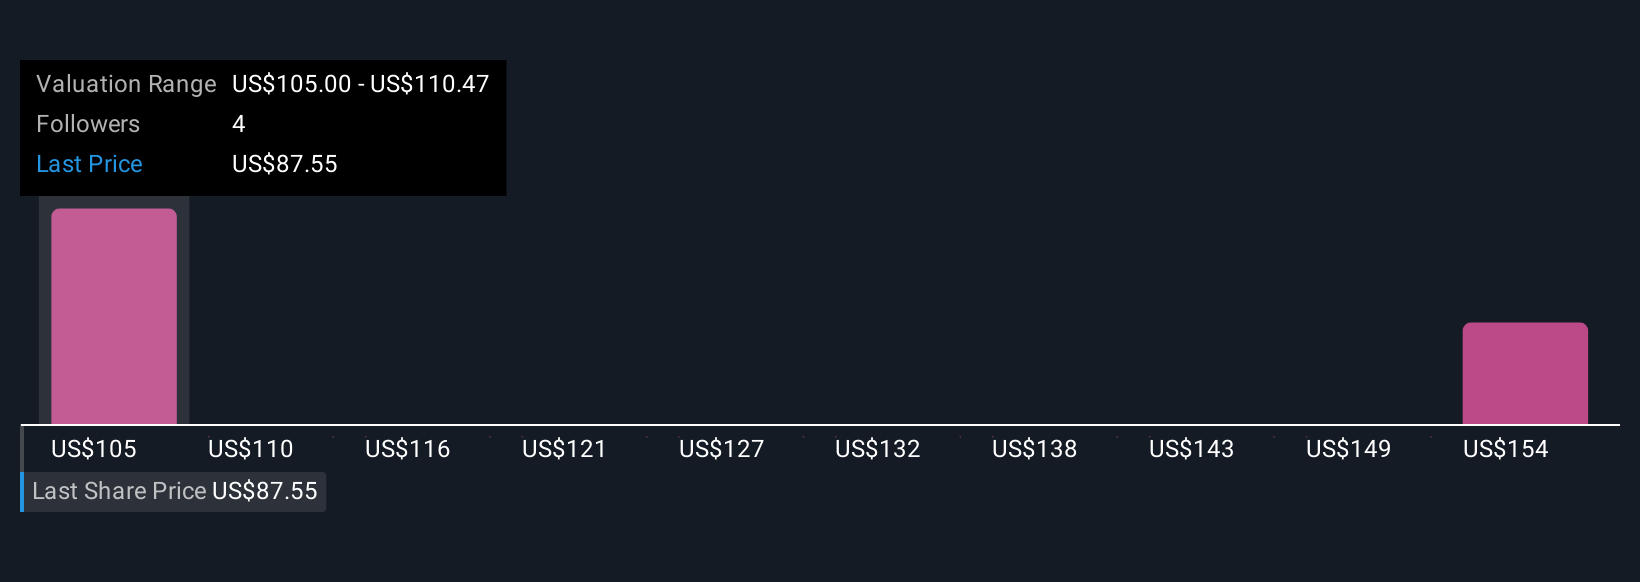
Because these Narratives refresh as soon as fresh news, earnings, or legislation appears, you’re never working with outdated thinking. For example, one investor might build a bullish Maximus Narrative around accelerating digital transformation, federal contracts, and margin improvement, aligning with a fair value near $120. Another might focus on risks like technological disruption and slow contract cycles, resulting in a more cautious $90 estimate. Narratives let you filter through all these perspectives and decide what makes sense for you.
Do you think there's more to the story for Maximus? Create your own Narrative to let the Community know!
This article by Simply Wall St is general in nature. We provide commentary based on historical data and analyst forecasts only using an unbiased methodology and our articles are not intended to be financial advice. It does not constitute a recommendation to buy or sell any stock, and does not take account of your objectives, or your financial situation. We aim to bring you long-term focused analysis driven by fundamental data. Note that our analysis may not factor in the latest price-sensitive company announcements or qualitative material. Simply Wall St has no position in any stocks mentioned.
New: Manage All Your Stock Portfolios in One Place
We've created the ultimate portfolio companion for stock investors, and it's free.
• Connect an unlimited number of Portfolios and see your total in one currency
• Be alerted to new Warning Signs or Risks via email or mobile
• Track the Fair Value of your stocks
Have feedback on this article? Concerned about the content? Get in touch with us directly. Alternatively, email editorial-team@simplywallst.com
About NYSE:MMS
Undervalued with proven track record.
Similar Companies
Market Insights

Advertisement
Community Narratives
Finding The True Value Of A Logistics Powerhouse
Fair Value US$95.21|8.4% undervalued
NV
Community Contributor
Paradigm Biopharmaceuticals Will Lead Osteoarthritis Treatment with Zilosul's FDA Success
Fair Value AU$5.50|92.1% undervalued
AM
Community Contributor
Barrick Mining (ABX:CA): A Gold Hedge against a U.S. Shutdown
Fair Value CA$60.00|24.2% undervalued
GM
Community Contributor