
Advertisement
- United States
- /
- Commercial Services
- /
- NYSE:HNI
Imagine Owning HNI (NYSE:HNI) And Wondering If The 23% Share Price Slide Is Justified

Want to participate in a short research study? Help shape the future of investing tools and you could win a $250 gift card!
For many investors, the main point of stock picking is to generate higher returns than the overall market. But its virtually certain that sometimes you will buy stocks that fall short of the market average returns. Unfortunately, that's been the case for longer term HNI Corporation (NYSE:HNI) shareholders, since the share price is down 23% in the last three years, falling well short of the market return of around 47%. The good news is that the stock is up 1.8% in the last week.
Check out our latest analysis for HNI
There is no denying that markets are sometimes efficient, but prices do not always reflect underlying business performance. One way to examine how market sentiment has changed over time is to look at the interaction between a company's share price and its earnings per share (EPS).
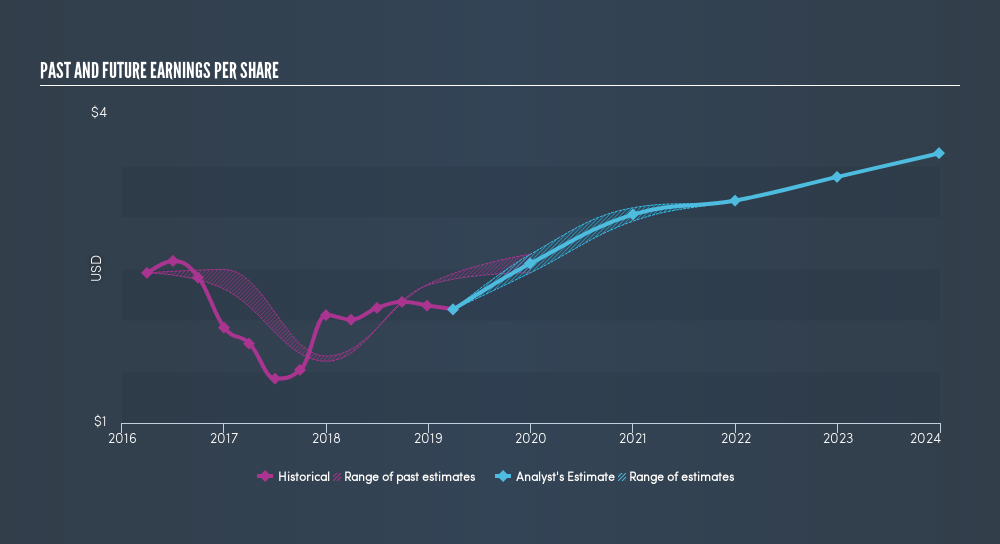
HNI saw its EPS decline at a compound rate of 5.1% per year, over the last three years. This reduction in EPS is slower than the 8.5% annual reduction in the share price. So it seems the market was too confident about the business, in the past.
You can see below how EPS has changed over time (discover the exact values by clicking on the image).
This free interactive report on HNI's earnings, revenue and cash flow is a great place to start, if you want to investigate the stock further.
What About Dividends?
When looking at investment returns, it is important to consider the difference between total shareholder return (TSR) and share price return. The TSR is a return calculation that accounts for the value of cash dividends (assuming that any dividend received was reinvested) and the calculated value of any discounted capital raisings and spin-offs. It's fair to say that the TSR gives a more complete picture for stocks that pay a dividend. We note that for HNI the TSR over the last 3 years was -17%, which is better than the share price return mentioned above. This is largely a result of its dividend payments!
A Different Perspective
Investors in HNI had a tough year, with a total loss of 5.3% (including dividends), against a market gain of about 3.2%. Even the share prices of good stocks drop sometimes, but we want to see improvements in the fundamental metrics of a business, before getting too interested. Longer term investors wouldn't be so upset, since they would have made 1.1%, each year, over five years. It could be that the recent sell-off is an opportunity, so it may be worth checking the fundamental data for signs of a long term growth trend. Before forming an opinion on HNI you might want to consider the cold hard cash it pays as a dividend. This free chart tracks its dividend over time.
If you would prefer to check out another company -- one with potentially superior financials -- then do not miss this free list of companies that have proven they can grow earnings.
Please note, the market returns quoted in this article reflect the market weighted average returns of stocks that currently trade on US exchanges.
We aim to bring you long-term focused research analysis driven by fundamental data. Note that our analysis may not factor in the latest price-sensitive company announcements or qualitative material.
If you spot an error that warrants correction, please contact the editor at editorial-team@simplywallst.com. This article by Simply Wall St is general in nature. It does not constitute a recommendation to buy or sell any stock, and does not take account of your objectives, or your financial situation. Simply Wall St has no position in the stocks mentioned. Thank you for reading.
About NYSE:HNI
HNI
Engages in the manufacture, sale, and marketing of workplace furnishings and residential building products primarily in the United States and Canada.
Undervalued with solid track record and pays a dividend.
Similar Companies
Market Insights


Advertisement
Community Narratives
The Future of Drug Testing? Fingerprint Tech Shows Serious Promise
Fair Value US$2.98|40.3% undervalued
JO
Community Contributor
Suncorp’s Next Chapter: Insurance-Only and Ready to Grow
Fair Value AU$22.83|7.6% undervalued
RO
Community Contributor
Thyssenkrupp Nucera Will Achieve Double-Digit Profits by 2030 Boosted by Hydrogen Growth
Fair Value €14.40|31.6% undervalued
CH
Community Contributor
Tesla’s Nvidia Moment – The AI & Robotics Inflection Point
Fair Value US$359.72|12.3% undervalued
BL
Community Contributor