
Advertisement

The goal of this article is to teach you how to use price to earnings ratios (P/E ratios). We'll show how you can use Brady Corporation's (NYSE:BRC) P/E ratio to inform your assessment of the investment opportunity. Brady has a P/E ratio of 16.06, based on the last twelve months. That means that at current prices, buyers pay $16.06 for every $1 in trailing yearly profits.
View our latest analysis for Brady
How Do You Calculate A P/E Ratio?
The formula for price to earnings is:
Price to Earnings Ratio = Price per Share ÷ Earnings per Share (EPS)
Or for Brady:
P/E of 16.06 = $42.880 ÷ $2.670 (Based on the year to January 2020.)
(Note: the above calculation results may not be precise due to rounding.)
Is A High Price-to-Earnings Ratio Good?
The higher the P/E ratio, the higher the price tag of a business, relative to its trailing earnings. That is not a good or a bad thing per se, but a high P/E does imply buyers are optimistic about the future.
How Does Brady's P/E Ratio Compare To Its Peers?
The P/E ratio indicates whether the market has higher or lower expectations of a company. The image below shows that Brady has a lower P/E than the average (19.2) P/E for companies in the commercial services industry.
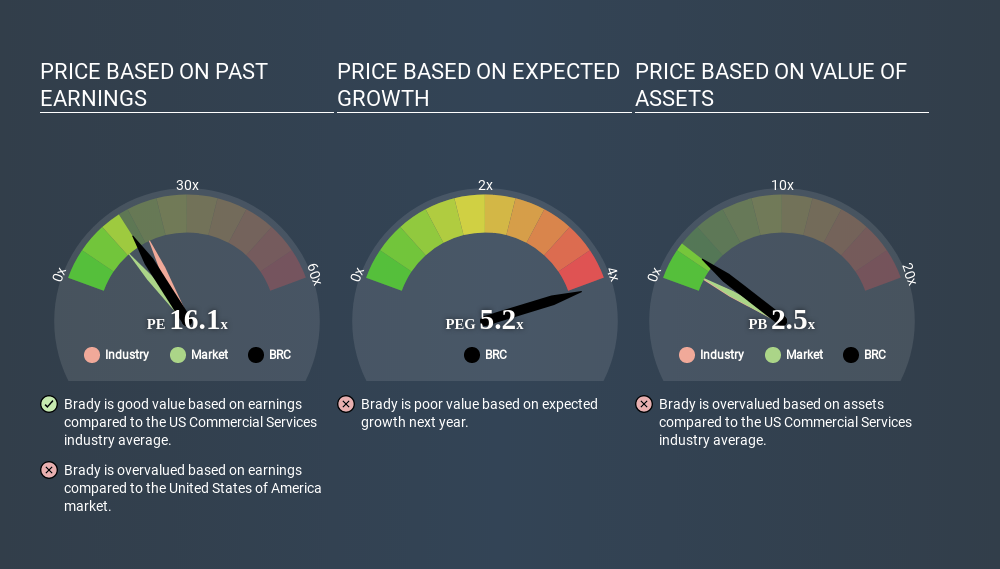
Its relatively low P/E ratio indicates that Brady shareholders think it will struggle to do as well as other companies in its industry classification. Many investors like to buy stocks when the market is pessimistic about their prospects. You should delve deeper. I like to check if company insiders have been buying or selling.
How Growth Rates Impact P/E Ratios
Probably the most important factor in determining what P/E a company trades on is the earnings growth. That's because companies that grow earnings per share quickly will rapidly increase the 'E' in the equation. Therefore, even if you pay a high multiple of earnings now, that multiple will become lower in the future. And as that P/E ratio drops, the company will look cheap, unless its share price increases.
Brady increased earnings per share by an impressive 16% over the last twelve months. And its annual EPS growth rate over 3 years is 13%. With that performance, you might expect an above average P/E ratio.
Remember: P/E Ratios Don't Consider The Balance Sheet
Don't forget that the P/E ratio considers market capitalization. So it won't reflect the advantage of cash, or disadvantage of debt. Hypothetically, a company could reduce its future P/E ratio by spending its cash (or taking on debt) to achieve higher earnings.
Such expenditure might be good or bad, in the long term, but the point here is that the balance sheet is not reflected by this ratio.
Brady's Balance Sheet
With net cash of US$240m, Brady has a very strong balance sheet, which may be important for its business. Having said that, at 10% of its market capitalization the cash hoard would contribute towards a higher P/E ratio.
The Bottom Line On Brady's P/E Ratio
Brady trades on a P/E ratio of 16.1, which is above its market average of 12.5. Its net cash position supports a higher P/E ratio, as does its solid recent earnings growth. Therefore it seems reasonable that the market would have relatively high expectations of the company
Investors have an opportunity when market expectations about a stock are wrong. If the reality for a company is better than it expects, you can make money by buying and holding for the long term. So this free report on the analyst consensus forecasts could help you make a master move on this stock.
You might be able to find a better buy than Brady. If you want a selection of possible winners, check out this free list of interesting companies that trade on a P/E below 20 (but have proven they can grow earnings).
If you spot an error that warrants correction, please contact the editor at editorial-team@simplywallst.com. This article by Simply Wall St is general in nature. It does not constitute a recommendation to buy or sell any stock, and does not take account of your objectives, or your financial situation. Simply Wall St has no position in the stocks mentioned.
We aim to bring you long-term focused research analysis driven by fundamental data. Note that our analysis may not factor in the latest price-sensitive company announcements or qualitative material. Thank you for reading.
About NYSE:BRC
Brady
Manufactures and supplies identification solutions (IDS) and workplace safety (WPS) products to identify and protect premises, products, and people in the United States and internationally.
Undervalued with excellent balance sheet and pays a dividend.
Similar Companies
Market Insights


Advertisement
Community Narratives
The Future of Drug Testing? Fingerprint Tech Shows Serious Promise
Fair Value US$2.98|40.3% undervalued
JO
Community Contributor
Suncorp’s Next Chapter: Insurance-Only and Ready to Grow
Fair Value AU$22.83|7.9% undervalued
RO
Community Contributor
Thyssenkrupp Nucera Will Achieve Double-Digit Profits by 2030 Boosted by Hydrogen Growth
Fair Value €14.40|31.6% undervalued
CH
Community Contributor
Tesla’s Nvidia Moment – The AI & Robotics Inflection Point
Fair Value US$359.72|12.3% undervalued
BL
Community Contributor