
Advertisement
- United States
- /
- Professional Services
- /
- NasdaqCM:VCIG
Investors Give VCI Global Limited (NASDAQ:VCIG) Shares A 60% Hiding
To the annoyance of some shareholders, VCI Global Limited (NASDAQ:VCIG) shares are down a considerable 60% in the last month, which continues a horrid run for the company. For any long-term shareholders, the last month ends a year to forget by locking in a 100% share price decline.
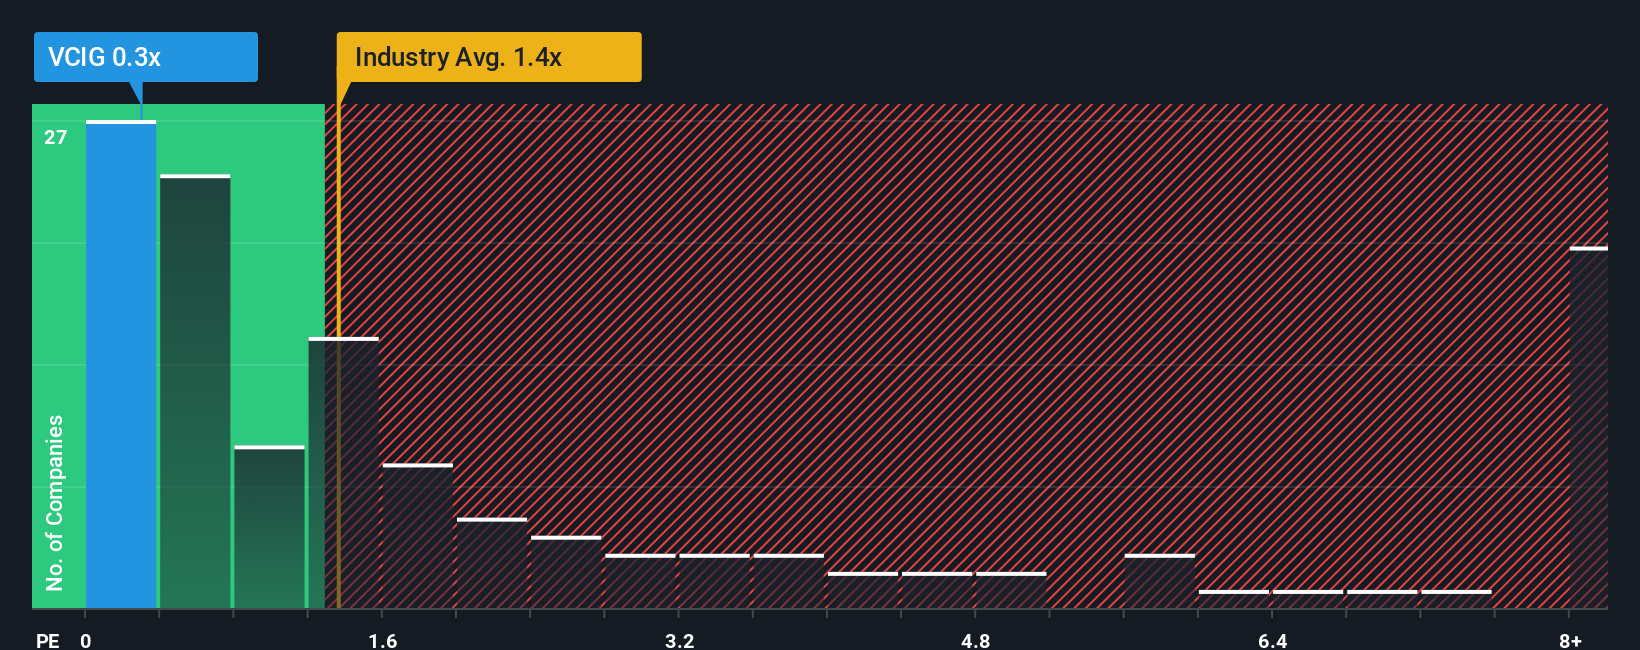
Since its price has dipped substantially, VCI Global may be sending buy signals at present with its price-to-sales (or "P/S") ratio of 0.3x, considering almost half of all companies in the Professional Services industry in the United States have P/S ratios greater than 1.4x and even P/S higher than 4x aren't out of the ordinary. Although, it's not wise to just take the P/S at face value as there may be an explanation why it's limited.
View our latest analysis for VCI Global
How Has VCI Global Performed Recently?
Revenue has risen firmly for VCI Global recently, which is pleasing to see. It might be that many expect the respectable revenue performance to degrade substantially, which has repressed the P/S. If that doesn't eventuate, then existing shareholders have reason to be optimistic about the future direction of the share price.
We don't have analyst forecasts, but you can see how recent trends are setting up the company for the future by checking out our free report on VCI Global's earnings, revenue and cash flow.What Are Revenue Growth Metrics Telling Us About The Low P/S?
In order to justify its P/S ratio, VCI Global would need to produce sluggish growth that's trailing the industry.
If we review the last year of revenue growth, the company posted a terrific increase of 25%. Pleasingly, revenue has also lifted 180% in aggregate from three years ago, thanks to the last 12 months of growth. So we can start by confirming that the company has done a great job of growing revenue over that time.
Comparing that to the industry, which is only predicted to deliver 6.6% growth in the next 12 months, the company's momentum is stronger based on recent medium-term annualised revenue results.
In light of this, it's peculiar that VCI Global's P/S sits below the majority of other companies. Apparently some shareholders believe the recent performance has exceeded its limits and have been accepting significantly lower selling prices.
The Final Word
The southerly movements of VCI Global's shares means its P/S is now sitting at a pretty low level. Using the price-to-sales ratio alone to determine if you should sell your stock isn't sensible, however it can be a practical guide to the company's future prospects.
We're very surprised to see VCI Global currently trading on a much lower than expected P/S since its recent three-year growth is higher than the wider industry forecast. When we see robust revenue growth that outpaces the industry, we presume that there are notable underlying risks to the company's future performance, which is exerting downward pressure on the P/S ratio. At least price risks look to be very low if recent medium-term revenue trends continue, but investors seem to think future revenue could see a lot of volatility.
Before you settle on your opinion, we've discovered 4 warning signs for VCI Global (2 don't sit too well with us!) that you should be aware of.
If strong companies turning a profit tickle your fancy, then you'll want to check out this free list of interesting companies that trade on a low P/E (but have proven they can grow earnings).
New: Manage All Your Stock Portfolios in One Place
We've created the ultimate portfolio companion for stock investors, and it's free.
• Connect an unlimited number of Portfolios and see your total in one currency
• Be alerted to new Warning Signs or Risks via email or mobile
• Track the Fair Value of your stocks
Have feedback on this article? Concerned about the content? Get in touch with us directly. Alternatively, email editorial-team (at) simplywallst.com.
This article by Simply Wall St is general in nature. We provide commentary based on historical data and analyst forecasts only using an unbiased methodology and our articles are not intended to be financial advice. It does not constitute a recommendation to buy or sell any stock, and does not take account of your objectives, or your financial situation. We aim to bring you long-term focused analysis driven by fundamental data. Note that our analysis may not factor in the latest price-sensitive company announcements or qualitative material. Simply Wall St has no position in any stocks mentioned.
About NasdaqCM:VCIG
VCI Global
Provides business and technology consulting services in Malaysia.
Excellent balance sheet and good value.
Market Insights

Advertisement
Community Narratives
MINISO's fair value is projected at 26.69 with an anticipated PE ratio shift of 20x
Fair Value US$24.03|11.4% undervalued
BE
Community Contributor
Procter & Gamble: A Dividend Giant Facing Slowing Growth
Fair Value US$119.81|23.5% overvalued
AN
Community Contributor
Eli Lilly's Future Growth Driven by Tirzepatide and Favorable Market Conditions
Fair Value US$1.19k|14.0% undervalued
EA
Community Contributor