Advertisement
- United States
- /
- Commercial Services
- /
- NasdaqGS:TILE
These 4 Measures Indicate That Interface (NASDAQ:TILE) Is Using Debt Extensively
Warren Buffett famously said, 'Volatility is far from synonymous with risk.' So it seems the smart money knows that debt - which is usually involved in bankruptcies - is a very important factor, when you assess how risky a company is. Importantly, Interface, Inc. (NASDAQ:TILE) does carry debt. But the real question is whether this debt is making the company risky.
What Risk Does Debt Bring?
Debt is a tool to help businesses grow, but if a business is incapable of paying off its lenders, then it exists at their mercy. Ultimately, if the company can't fulfill its legal obligations to repay debt, shareholders could walk away with nothing. While that is not too common, we often do see indebted companies permanently diluting shareholders because lenders force them to raise capital at a distressed price. Of course, debt can be an important tool in businesses, particularly capital heavy businesses. The first step when considering a company's debt levels is to consider its cash and debt together.
See our latest analysis for Interface
What Is Interface's Net Debt?
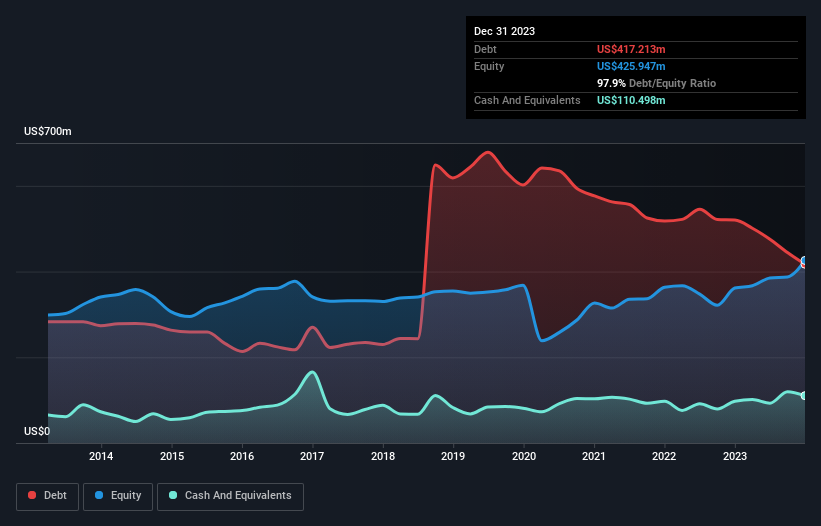
The image below, which you can click on for greater detail, shows that Interface had debt of US$417.2m at the end of December 2023, a reduction from US$520.2m over a year. However, because it has a cash reserve of US$110.5m, its net debt is less, at about US$306.7m.
How Strong Is Interface's Balance Sheet?
According to the last reported balance sheet, Interface had liabilities of US$214.7m due within 12 months, and liabilities of US$589.4m due beyond 12 months. Offsetting these obligations, it had cash of US$110.5m as well as receivables valued at US$163.4m due within 12 months. So its liabilities total US$530.3m more than the combination of its cash and short-term receivables.
This deficit is considerable relative to its market capitalization of US$882.1m, so it does suggest shareholders should keep an eye on Interface's use of debt. Should its lenders demand that it shore up the balance sheet, shareholders would likely face severe dilution.
In order to size up a company's debt relative to its earnings, we calculate its net debt divided by its earnings before interest, tax, depreciation, and amortization (EBITDA) and its earnings before interest and tax (EBIT) divided by its interest expense (its interest cover). Thus we consider debt relative to earnings both with and without depreciation and amortization expenses.
Interface has net debt worth 2.1 times EBITDA, which isn't too much, but its interest cover looks a bit on the low side, with EBIT at only 3.2 times the interest expense. While these numbers do not alarm us, it's worth noting that the cost of the company's debt is having a real impact. The bad news is that Interface saw its EBIT decline by 15% over the last year. If that sort of decline is not arrested, then the managing its debt will be harder than selling broccoli flavoured ice-cream for a premium. When analysing debt levels, the balance sheet is the obvious place to start. But it is future earnings, more than anything, that will determine Interface's ability to maintain a healthy balance sheet going forward. So if you're focused on the future you can check out this free report showing analyst profit forecasts.
Finally, while the tax-man may adore accounting profits, lenders only accept cold hard cash. So we clearly need to look at whether that EBIT is leading to corresponding free cash flow. During the last three years, Interface produced sturdy free cash flow equating to 60% of its EBIT, about what we'd expect. This cold hard cash means it can reduce its debt when it wants to.
Our View
We'd go so far as to say Interface's EBIT growth rate was disappointing. But at least it's pretty decent at converting EBIT to free cash flow; that's encouraging. Looking at the balance sheet and taking into account all these factors, we do believe that debt is making Interface stock a bit risky. That's not necessarily a bad thing, but we'd generally feel more comfortable with less leverage. When analysing debt levels, the balance sheet is the obvious place to start. However, not all investment risk resides within the balance sheet - far from it. Case in point: We've spotted 1 warning sign for Interface you should be aware of.
If you're interested in investing in businesses that can grow profits without the burden of debt, then check out this free list of growing businesses that have net cash on the balance sheet.
New: AI Stock Screener & Alerts
Our new AI Stock Screener scans the market every day to uncover opportunities.
• Dividend Powerhouses (3%+ Yield)
• Undervalued Small Caps with Insider Buying
• High growth Tech and AI Companies
Or build your own from over 50 metrics.
Have feedback on this article? Concerned about the content? Get in touch with us directly. Alternatively, email editorial-team (at) simplywallst.com.
This article by Simply Wall St is general in nature. We provide commentary based on historical data and analyst forecasts only using an unbiased methodology and our articles are not intended to be financial advice. It does not constitute a recommendation to buy or sell any stock, and does not take account of your objectives, or your financial situation. We aim to bring you long-term focused analysis driven by fundamental data. Note that our analysis may not factor in the latest price-sensitive company announcements or qualitative material. Simply Wall St has no position in any stocks mentioned.
About NasdaqGS:TILE
Interface
Designs, produces, and sells modular carpet products in the United States, Canada, Latin America, Europe, Africa, Asia, and Australia.
Very undervalued with flawless balance sheet.
Similar Companies
Market Insights

Advertisement
Weekly Picks
LO


Lou_Basenese on Cue Biopharma ·
Cue Biopharma (NASDAQ: CUE): The Scientist Behind Xolair Just Gave Cue a Next-Generation Shot at the Same Multi-Billion-Dollar Market
Fair Value:US$7057.7% undervalued
9 followersusers have followed this narrative
0 commentsusers have commented on this narrative
4 likesusers have liked this narrative
HE


HedgeY on AST SpaceMobile ·
AST SpaceMobile: The Boldest Direct-to-Cell Bet in Public Markets
Fair Value:US$17036.9% undervalued
33 followersusers have followed this narrative
0 commentsusers have commented on this narrative
10 likesusers have liked this narrative
FU

FundamentalFlow on Onto Innovation ·
Onto Innovation: The Advanced Packaging Chokepoint 51.3% undervalued intrinsic discount
Fair Value:US$38027.7% undervalued
23 followersusers have followed this narrative
0 commentsusers have commented on this narrative
6 likesusers have liked this narrative
MA


martinarauz on Nu Holdings ·
Investment Analysis (May 2026)
Fair Value:US$22.7446.7% undervalued
55 followersusers have followed this narrative
0 commentsusers have commented on this narrative
14 likesusers have liked this narrative
Recently Updated Narratives
IM


Imthetxarbi on Sylvania Platinum ·
A Debt-Free PGM Producer Trading at 2x EBITDA With a 10% Dividend Yield Nobody Is Talking About
Fair Value:UK£2.0855.3% undervalued
1 followerusers have followed this narrative
0 commentsusers have commented on this narrative
0 likesusers have liked this narrative
IM

Imthetxarbi on Watches of Switzerland Group ·
A Compelling Compounder at a Retailer's Multiple
Fair Value:UK£1134.8% undervalued
1 followerusers have followed this narrative
0 commentsusers have commented on this narrative
0 likesusers have liked this narrative
KA


kapirey on Zijin Mining Group ·
Zijin Mining is a scaled, globally diversified mining platform
Fair Value:HK$60.1444.6% undervalued
2 followersusers have followed this narrative
0 commentsusers have commented on this narrative
0 likesusers have liked this narrative
Popular Narratives
CL


Clive_Thompson on Take-Two Interactive Software ·
Take-Two Interactive: The Calm Before the Storm NASDAQ: TTWO Last Price: $242.41 Date: May 15, 2026
Fair Value:US$276.9721.8% undervalued
56 followersusers have followed this narrative
0 commentsusers have commented on this narrative
14 likesusers have liked this narrative
MA
martinarauz on Nu Holdings ·
Investment Analysis (May 2026)
Fair Value:US$22.7446.7% undervalued
55 followersusers have followed this narrative
0 commentsusers have commented on this narrative
14 likesusers have liked this narrative
NI


niteco on Honeywell International ·
Honeywell - The Demand-Side of the AI Infrastructure
Fair Value:US$320.1932.0% undervalued
46 followersusers have followed this narrative
0 commentsusers have commented on this narrative
19 likesusers have liked this narrative
Trending Discussion

FR

FrontierTom on United States Antimony ·
Great Long term play that needs great tolerance for price swings along the way.
0
|0
