
Advertisement
- United States
- /
- Commercial Services
- /
- NasdaqGS:TILE
Further Upside For Interface, Inc. (NASDAQ:TILE) Shares Could Introduce Price Risks After 28% Bounce

Interface, Inc. (NASDAQ:TILE) shareholders have had their patience rewarded with a 28% share price jump in the last month. The last 30 days bring the annual gain to a very sharp 62%.
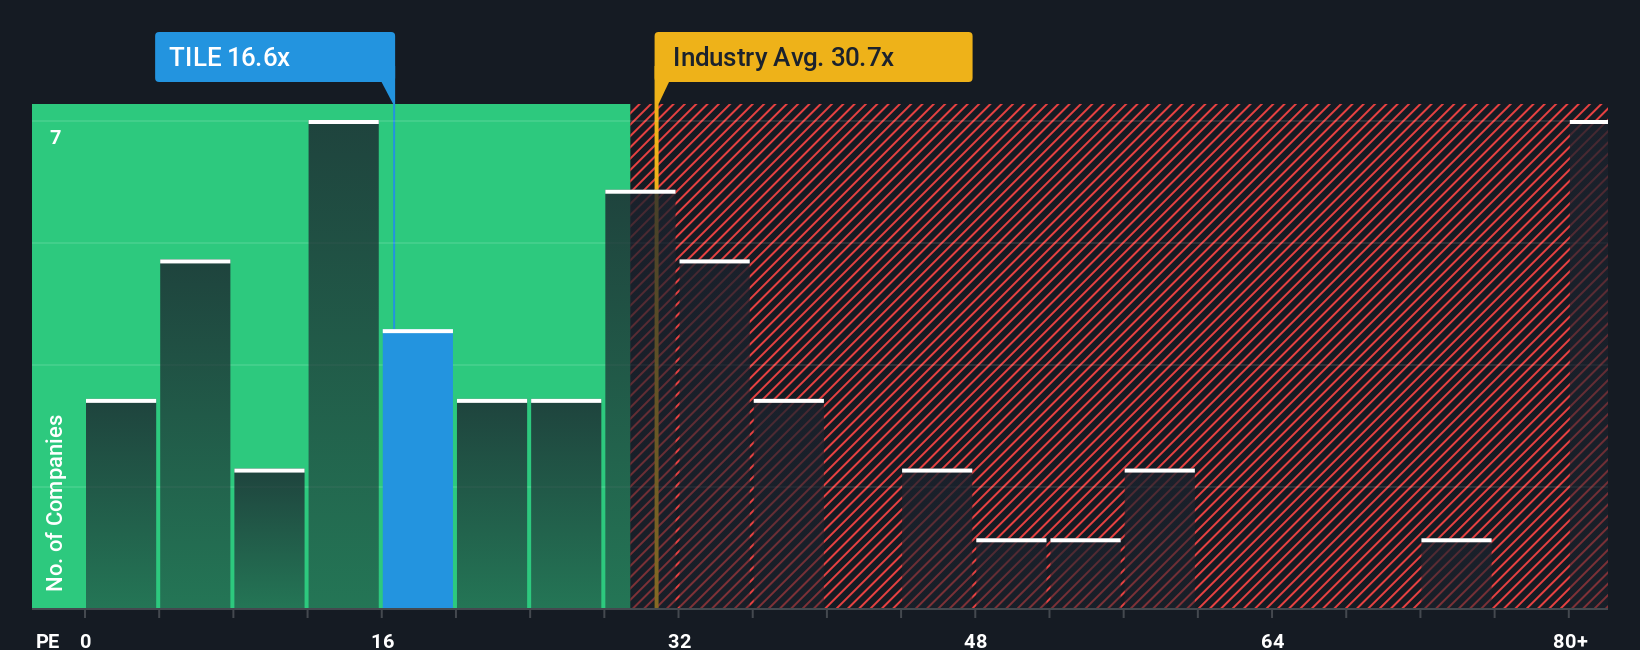
Although its price has surged higher, given about half the companies in the United States have price-to-earnings ratios (or "P/E's") above 20x, you may still consider Interface as an attractive investment with its 16.6x P/E ratio. Nonetheless, we'd need to dig a little deeper to determine if there is a rational basis for the reduced P/E.
Recent times have been advantageous for Interface as its earnings have been rising faster than most other companies. One possibility is that the P/E is low because investors think this strong earnings performance might be less impressive moving forward. If not, then existing shareholders have reason to be quite optimistic about the future direction of the share price.
Check out our latest analysis for Interface
Does Growth Match The Low P/E?
The only time you'd be truly comfortable seeing a P/E as low as Interface's is when the company's growth is on track to lag the market.
If we review the last year of earnings growth, the company posted a terrific increase of 45%. The latest three year period has also seen an excellent 57% overall rise in EPS, aided by its short-term performance. Accordingly, shareholders would have probably welcomed those medium-term rates of earnings growth.
Turning to the outlook, the next three years should generate growth of 9.4% per annum as estimated by the three analysts watching the company. That's shaping up to be similar to the 11% each year growth forecast for the broader market.
With this information, we find it odd that Interface is trading at a P/E lower than the market. Apparently some shareholders are doubtful of the forecasts and have been accepting lower selling prices.
What We Can Learn From Interface's P/E?
Interface's stock might have been given a solid boost, but its P/E certainly hasn't reached any great heights. Generally, our preference is to limit the use of the price-to-earnings ratio to establishing what the market thinks about the overall health of a company.
Our examination of Interface's analyst forecasts revealed that its market-matching earnings outlook isn't contributing to its P/E as much as we would have predicted. There could be some unobserved threats to earnings preventing the P/E ratio from matching the outlook. At least the risk of a price drop looks to be subdued, but investors seem to think future earnings could see some volatility.
Before you settle on your opinion, we've discovered 1 warning sign for Interface that you should be aware of.
If you're unsure about the strength of Interface's business, why not explore our interactive list of stocks with solid business fundamentals for some other companies you may have missed.
New: AI Stock Screener & Alerts
Our new AI Stock Screener scans the market every day to uncover opportunities.
• Dividend Powerhouses (3%+ Yield)
• Undervalued Small Caps with Insider Buying
• High growth Tech and AI Companies
Or build your own from over 50 metrics.
Have feedback on this article? Concerned about the content? Get in touch with us directly. Alternatively, email editorial-team (at) simplywallst.com.
This article by Simply Wall St is general in nature. We provide commentary based on historical data and analyst forecasts only using an unbiased methodology and our articles are not intended to be financial advice. It does not constitute a recommendation to buy or sell any stock, and does not take account of your objectives, or your financial situation. We aim to bring you long-term focused analysis driven by fundamental data. Note that our analysis may not factor in the latest price-sensitive company announcements or qualitative material. Simply Wall St has no position in any stocks mentioned.
About NasdaqGS:TILE
Interface
Designs, produces, and sells modular carpet products in the United States, Canada, Latin America, Europe, Africa, Asia, and Australia.
Very undervalued with flawless balance sheet.
Similar Companies
Market Insights

Advertisement
Community Narratives
MicroVision will explode future revenue by 380.37% with a vision towards success
Fair Value US$60|98.4% undervalued
TH
Community Contributor
The Indispensable Artery for a New North American Economy
Fair Value CA$132.87|0.7% overvalued
TI
Community Contributor
Recently Updated Narratives
CE

cementafriend on Constellation Energy ·
Constellation Energy Dividends and Growth
Fair Value:US$348.054.7% overvalued
2 followersusers have followed this narrative
0 commentsusers have commented on this narrative
0 likesusers have liked this narrative
KH

Khagani on CoreWeave ·
CoreWeave's Revenue Expected to Rocket 77.88% in 5-Year Forecast
Fair Value:US$11033.5% undervalued
3 followersusers have followed this narrative
0 commentsusers have commented on this narrative
0 likesusers have liked this narrative
PO

PortfolioPlus on Bisalloy Steel Group ·
Bisalloy Steel Group will shine with a projected profit margin increase of 12.8%
Fair Value:AU$6.7118.0% undervalued
3 followersusers have followed this narrative
0 commentsusers have commented on this narrative
0 likesusers have liked this narrative
Popular Narratives
TH

TheWallstreetKing on MicroVision ·
MicroVision will explode future revenue by 380.37% with a vision towards success
Fair Value:US$6098.4% undervalued
106 followersusers have followed this narrative
10 commentsusers have commented on this narrative
21 likesusers have liked this narrative
AN


AnalystConsensusTarget on NVIDIA ·
NVDA: Expanding AI Demand Will Drive Major Data Center Investments Through 2026
Fair Value:US$250.3929.3% undervalued
936 followersusers have followed this narrative
6 commentsusers have commented on this narrative
24 likesusers have liked this narrative
OS


oscargarcia on Alphabet ·
The company that turned a verb into a global necessity and basically runs the modern internet, digital ads, smartphones, maps, and AI.
Fair Value:US$3405.8% undervalued
144 followersusers have followed this narrative
6 commentsusers have commented on this narrative
18 likesusers have liked this narrative