- United States
- /
- Professional Services
- /
- NasdaqGS:SAIC
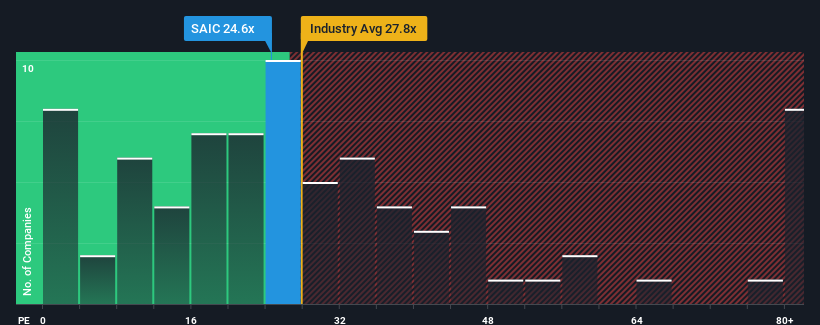
What You Can Learn From Science Applications International Corporation's (NASDAQ:SAIC) P/E

Science Applications International Corporation's (NASDAQ:SAIC) price-to-earnings (or "P/E") ratio of 24.6x might make it look like a sell right now compared to the market in the United States, where around half of the companies have P/E ratios below 18x and even P/E's below 10x are quite common. Although, it's not wise to just take the P/E at face value as there may be an explanation why it's as high as it is.
With earnings that are retreating more than the market's of late, Science Applications International has been very sluggish. One possibility is that the P/E is high because investors think the company will turn things around completely and accelerate past most others in the market. You'd really hope so, otherwise you're paying a pretty hefty price for no particular reason.
See our latest analysis for Science Applications International
Does Growth Match The High P/E?
Science Applications International's P/E ratio would be typical for a company that's expected to deliver solid growth, and importantly, perform better than the market.
Taking a look back first, the company's earnings per share growth last year wasn't something to get excited about as it posted a disappointing decline of 39%. That put a dampener on the good run it was having over the longer-term as its three-year EPS growth is still a noteworthy 19% in total. Accordingly, while they would have preferred to keep the run going, shareholders would be roughly satisfied with the medium-term rates of earnings growth.
Shifting to the future, estimates from the eight analysts covering the company suggest earnings should grow by 22% over the next year. With the market only predicted to deliver 15%, the company is positioned for a stronger earnings result.
With this information, we can see why Science Applications International is trading at such a high P/E compared to the market. Apparently shareholders aren't keen to offload something that is potentially eyeing a more prosperous future.
The Final Word
Generally, our preference is to limit the use of the price-to-earnings ratio to establishing what the market thinks about the overall health of a company.
As we suspected, our examination of Science Applications International's analyst forecasts revealed that its superior earnings outlook is contributing to its high P/E. Right now shareholders are comfortable with the P/E as they are quite confident future earnings aren't under threat. Unless these conditions change, they will continue to provide strong support to the share price.
It is also worth noting that we have found 2 warning signs for Science Applications International (1 can't be ignored!) that you need to take into consideration.
If P/E ratios interest you, you may wish to see this free collection of other companies with strong earnings growth and low P/E ratios.
The New Payments ETF Is Live on NASDAQ:
Money is moving to real-time rails, and a newly listed ETF now gives investors direct exposure. Fast settlement. Institutional custody. Simple access.
Explore how this launch could reshape portfolios
Sponsored ContentNew: Manage All Your Stock Portfolios in One Place
We've created the ultimate portfolio companion for stock investors, and it's free.
• Connect an unlimited number of Portfolios and see your total in one currency
• Be alerted to new Warning Signs or Risks via email or mobile
• Track the Fair Value of your stocks
Have feedback on this article? Concerned about the content? Get in touch with us directly. Alternatively, email editorial-team (at) simplywallst.com.
This article by Simply Wall St is general in nature. We provide commentary based on historical data and analyst forecasts only using an unbiased methodology and our articles are not intended to be financial advice. It does not constitute a recommendation to buy or sell any stock, and does not take account of your objectives, or your financial situation. We aim to bring you long-term focused analysis driven by fundamental data. Note that our analysis may not factor in the latest price-sensitive company announcements or qualitative material. Simply Wall St has no position in any stocks mentioned.
About NasdaqGS:SAIC
Science Applications International
Provides technical, engineering, and enterprise information technology (IT) services in the United States.
Undervalued with solid track record and pays a dividend.
Similar Companies
Market Insights

Weekly Picks

Early mover in a fast growing industry. Likely to experience share price volatility as they scale


A case for CA$31.80 (undiluted), aka 8,616% upside from CA$0.37 (an 86 bagger!).


Moderation and Stabilisation: HOLD: Fair Price based on a 4-year Cycle is $12.08
Recently Updated Narratives

Airbnb Stock: Platform Growth in a World of Saturation and Scrutiny

Clarivate Stock: When Data Becomes the Backbone of Innovation and Law

Adobe Stock: AI-Fueled ARR Growth Pushes Guidance Higher, But Cost Pressures Loom
Popular Narratives


Crazy Undervalued 42 Baggers Silver Play (Active & Running Mine)


NVDA: Expanding AI Demand Will Drive Major Data Center Investments Through 2026


MicroVision will explode future revenue by 380.37% with a vision towards success
Trending Discussion
