
Advertisement
- United States
- /
- Commercial Services
- /
- NasdaqGS:HCSG
Healthcare Services Group (NASDAQ:HCSG) Could Be Struggling To Allocate Capital
When researching a stock for investment, what can tell us that the company is in decline? When we see a declining return on capital employed (ROCE) in conjunction with a declining base of capital employed, that's often how a mature business shows signs of aging. This combination can tell you that not only is the company investing less, it's earning less on what it does invest. So after glancing at the trends within Healthcare Services Group (NASDAQ:HCSG), we weren't too hopeful.
Understanding Return On Capital Employed (ROCE)
For those that aren't sure what ROCE is, it measures the amount of pre-tax profits a company can generate from the capital employed in its business. The formula for this calculation on Healthcare Services Group is:
Return on Capital Employed = Earnings Before Interest and Tax (EBIT) ÷ (Total Assets - Current Liabilities)
0.065 = US$39m ÷ (US$800m - US$209m) (Based on the trailing twelve months to June 2024).
Thus, Healthcare Services Group has an ROCE of 6.5%. In absolute terms, that's a low return and it also under-performs the Commercial Services industry average of 10%.
View our latest analysis for Healthcare Services Group
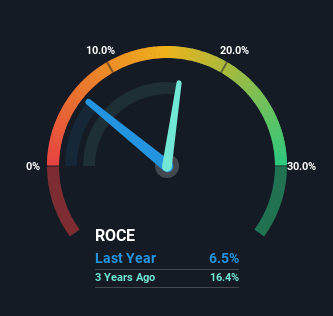
Above you can see how the current ROCE for Healthcare Services Group compares to its prior returns on capital, but there's only so much you can tell from the past. If you'd like, you can check out the forecasts from the analysts covering Healthcare Services Group for free.
What Can We Tell From Healthcare Services Group's ROCE Trend?
In terms of Healthcare Services Group's historical ROCE movements, the trend doesn't inspire confidence. To be more specific, the ROCE was 18% five years ago, but since then it has dropped noticeably. Meanwhile, capital employed in the business has stayed roughly the flat over the period. Companies that exhibit these attributes tend to not be shrinking, but they can be mature and facing pressure on their margins from competition. If these trends continue, we wouldn't expect Healthcare Services Group to turn into a multi-bagger.
In Conclusion...
All in all, the lower returns from the same amount of capital employed aren't exactly signs of a compounding machine. Long term shareholders who've owned the stock over the last five years have experienced a 48% depreciation in their investment, so it appears the market might not like these trends either. Unless there is a shift to a more positive trajectory in these metrics, we would look elsewhere.
Healthcare Services Group could be trading at an attractive price in other respects, so you might find our free intrinsic value estimation for HCSG on our platform quite valuable.
While Healthcare Services Group may not currently earn the highest returns, we've compiled a list of companies that currently earn more than 25% return on equity. Check out this free list here.
Valuation is complex, but we're here to simplify it.
Discover if Healthcare Services Group might be undervalued or overvalued with our detailed analysis, featuring fair value estimates, potential risks, dividends, insider trades, and its financial condition.
Access Free AnalysisHave feedback on this article? Concerned about the content? Get in touch with us directly. Alternatively, email editorial-team (at) simplywallst.com.
This article by Simply Wall St is general in nature. We provide commentary based on historical data and analyst forecasts only using an unbiased methodology and our articles are not intended to be financial advice. It does not constitute a recommendation to buy or sell any stock, and does not take account of your objectives, or your financial situation. We aim to bring you long-term focused analysis driven by fundamental data. Note that our analysis may not factor in the latest price-sensitive company announcements or qualitative material. Simply Wall St has no position in any stocks mentioned.
About NasdaqGS:HCSG
Healthcare Services Group
Provides management, administrative, and operating services to the housekeeping, laundry, linen, facility maintenance, and dietary service departments of nursing homes, retirement complexes, rehabilitation centers, and hospitals in the United States.
Flawless balance sheet with moderate growth potential.
Market Insights

Advertisement
Community Narratives
The Next Phase of Energy Storage: How NeoVolta Is Tackling America’s Power Crunch
Fair Value US$7.50|35.1% undervalued
MA
Community Contributor
Why EnSilica is Worth Possibly 13x its Current Price
Fair Value UK£5.00|89.8% undervalued
DO
Community Contributor
M&A Activity, Industry Diversification & A Defense Contract Monopoly Will Push BWXT For Healthy Long-Term Growth
Fair Value US$220.00|15.2% undervalued
CL
Community Contributor
A case for Cassiar Gold Corp (TSXV: GLDC) to reach CAD$8-10 before 2030 (X30-37)
Fair Value CA$10.00|96.0% undervalued
AG
Community Contributor