
Advertisement
- United States
- /
- Consumer Services
- /
- NasdaqGS:DRVN
The Market Doesn't Like What It Sees From Driven Brands Holdings Inc.'s (NASDAQ:DRVN) Revenues Yet As Shares Tumble 26%
Driven Brands Holdings Inc. (NASDAQ:DRVN) shares have had a horrible month, losing 26% after a relatively good period beforehand. For any long-term shareholders, the last month ends a year to forget by locking in a 60% share price decline.
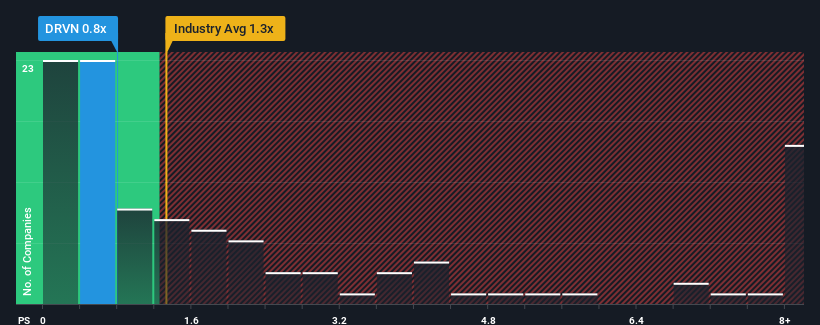
After such a large drop in price, Driven Brands Holdings may be sending bullish signals at the moment with its price-to-sales (or "P/S") ratio of 0.8x, since almost half of all companies in the Commercial Services industry in the United States have P/S ratios greater than 1.3x and even P/S higher than 4x are not unusual. Nonetheless, we'd need to dig a little deeper to determine if there is a rational basis for the reduced P/S.
Check out our latest analysis for Driven Brands Holdings
How Has Driven Brands Holdings Performed Recently?
Recent times haven't been great for Driven Brands Holdings as its revenue has been rising slower than most other companies. The P/S ratio is probably low because investors think this lacklustre revenue performance isn't going to get any better. If this is the case, then existing shareholders will probably struggle to get excited about the future direction of the share price.
Keen to find out how analysts think Driven Brands Holdings' future stacks up against the industry? In that case, our free report is a great place to start.Do Revenue Forecasts Match The Low P/S Ratio?
Driven Brands Holdings' P/S ratio would be typical for a company that's only expected to deliver limited growth, and importantly, perform worse than the industry.
Retrospectively, the last year delivered a decent 8.9% gain to the company's revenues. This was backed up an excellent period prior to see revenue up by 120% in total over the last three years. So we can start by confirming that the company has done a great job of growing revenues over that time.
Turning to the outlook, the next three years should generate growth of 8.5% each year as estimated by the eleven analysts watching the company. Meanwhile, the rest of the industry is forecast to expand by 19% each year, which is noticeably more attractive.
With this information, we can see why Driven Brands Holdings is trading at a P/S lower than the industry. Apparently many shareholders weren't comfortable holding on while the company is potentially eyeing a less prosperous future.
What We Can Learn From Driven Brands Holdings' P/S?
The southerly movements of Driven Brands Holdings' shares means its P/S is now sitting at a pretty low level. It's argued the price-to-sales ratio is an inferior measure of value within certain industries, but it can be a powerful business sentiment indicator.
We've established that Driven Brands Holdings maintains its low P/S on the weakness of its forecast growth being lower than the wider industry, as expected. Shareholders' pessimism on the revenue prospects for the company seems to be the main contributor to the depressed P/S. The company will need a change of fortune to justify the P/S rising higher in the future.
Before you take the next step, you should know about the 1 warning sign for Driven Brands Holdings that we have uncovered.
It's important to make sure you look for a great company, not just the first idea you come across. So if growing profitability aligns with your idea of a great company, take a peek at this free list of interesting companies with strong recent earnings growth (and a low P/E).
New: Manage All Your Stock Portfolios in One Place
We've created the ultimate portfolio companion for stock investors, and it's free.
• Connect an unlimited number of Portfolios and see your total in one currency
• Be alerted to new Warning Signs or Risks via email or mobile
• Track the Fair Value of your stocks
Have feedback on this article? Concerned about the content? Get in touch with us directly. Alternatively, email editorial-team (at) simplywallst.com.
This article by Simply Wall St is general in nature. We provide commentary based on historical data and analyst forecasts only using an unbiased methodology and our articles are not intended to be financial advice. It does not constitute a recommendation to buy or sell any stock, and does not take account of your objectives, or your financial situation. We aim to bring you long-term focused analysis driven by fundamental data. Note that our analysis may not factor in the latest price-sensitive company announcements or qualitative material. Simply Wall St has no position in any stocks mentioned.
About NasdaqGS:DRVN
Driven Brands Holdings
Provides automotive services to retail and commercial customers in the United States, Canada, and internationally.
Very undervalued with reasonable growth potential.
Market Insights

Advertisement
Community Narratives
Kodiak AI - a potential 100 bagger opportunity?
Fair Value US$14.00|44.7% undervalued
DA
Community Contributor
A Fair Price for a Great Business Facing Real Threats
Fair Value US$383.06|13.0% undervalued
IM
Community Contributor
AXON And Shopify Integration Will Unlock Global Mobile Advertising
Fair Value US$646.30|0% overvalued
AN
Based on Analyst Price Targets