Advertisement
- United States
- /
- Electrical
- /
- NYSE:VRT
Is Vertiv Still Attractive After Surging 29% on Data Center Momentum in 2025?

Simply Wall St
Reviewed by Bailey Pemberton
Thinking about what to do with Vertiv Holdings Co stock? You’re not alone. The company’s recent performance has caught the market’s attention, and it’s tough to ignore the kind of gains Vertiv has posted. In just the past week, shares have jumped 15.6%, and if you zoom out to the last month, they’re up 29.2%. Year to date, Vertiv stock has surged 35.4%, and for those who’ve held on for the ride over the past year, it’s delivered a hefty 52.5%. Stretch that timeframe out to the last three years, and the return stands at 1,368.2%, with five-year gains at 792%. Those are significant numbers by any standard, and they reflect both optimism about Vertiv’s opportunities in the data center and critical infrastructure space, and the evolving way investors weigh its risks and prospects.
Of course, strong price performance often raises an important question: are you getting in on a great company, or just following momentum? That is where valuation comes into play. According to a commonly used value scoring system, Vertiv currently scores a 0 out of 6, indicating the stock does not check any boxes as undervalued by these traditional metrics. But before you make a decision—buy, hold, or sell—it is worth diving deeper into what those valuation checks really mean, how analysts come up with their scores, and whether there is a more insightful way to judge Vertiv’s true value. Here is a breakdown of the main approaches analysts use to value a company like Vertiv, with the most insightful perspective saved for last.
Vertiv Holdings Co scores just 0/6 on our valuation checks. See what other red flags we found in the full valuation breakdown.
Approach 1: Vertiv Holdings Co Discounted Cash Flow (DCF) Analysis
The Discounted Cash Flow (DCF) model estimates a company's value by forecasting its future cash flows and then discounting those amounts back to today's dollars. This approach aims to capture what the company is really worth today, based on how much cash it is expected to generate in the future.
For Vertiv Holdings Co, the most recent reported Free Cash Flow (FCF) is $1.24 Billion. Analysts expect noticeable growth in these cash flows, with projections rising to $3.08 Billion by 2029. For years beyond analysts’ direct estimates, Simply Wall St extrapolates future cash flows, resulting in a ten-year projection of steadily increasing FCF figures. This helps create a smooth outlook based on reasonable historic and industry trends.
After applying the DCF method, Vertiv's estimated intrinsic value is $138.57 per share. Compared to the current price, this indicates the stock is trading at a 15.6% premium. In this analysis, the stock is considered 15.6% overvalued.
Result: OVERVALUED
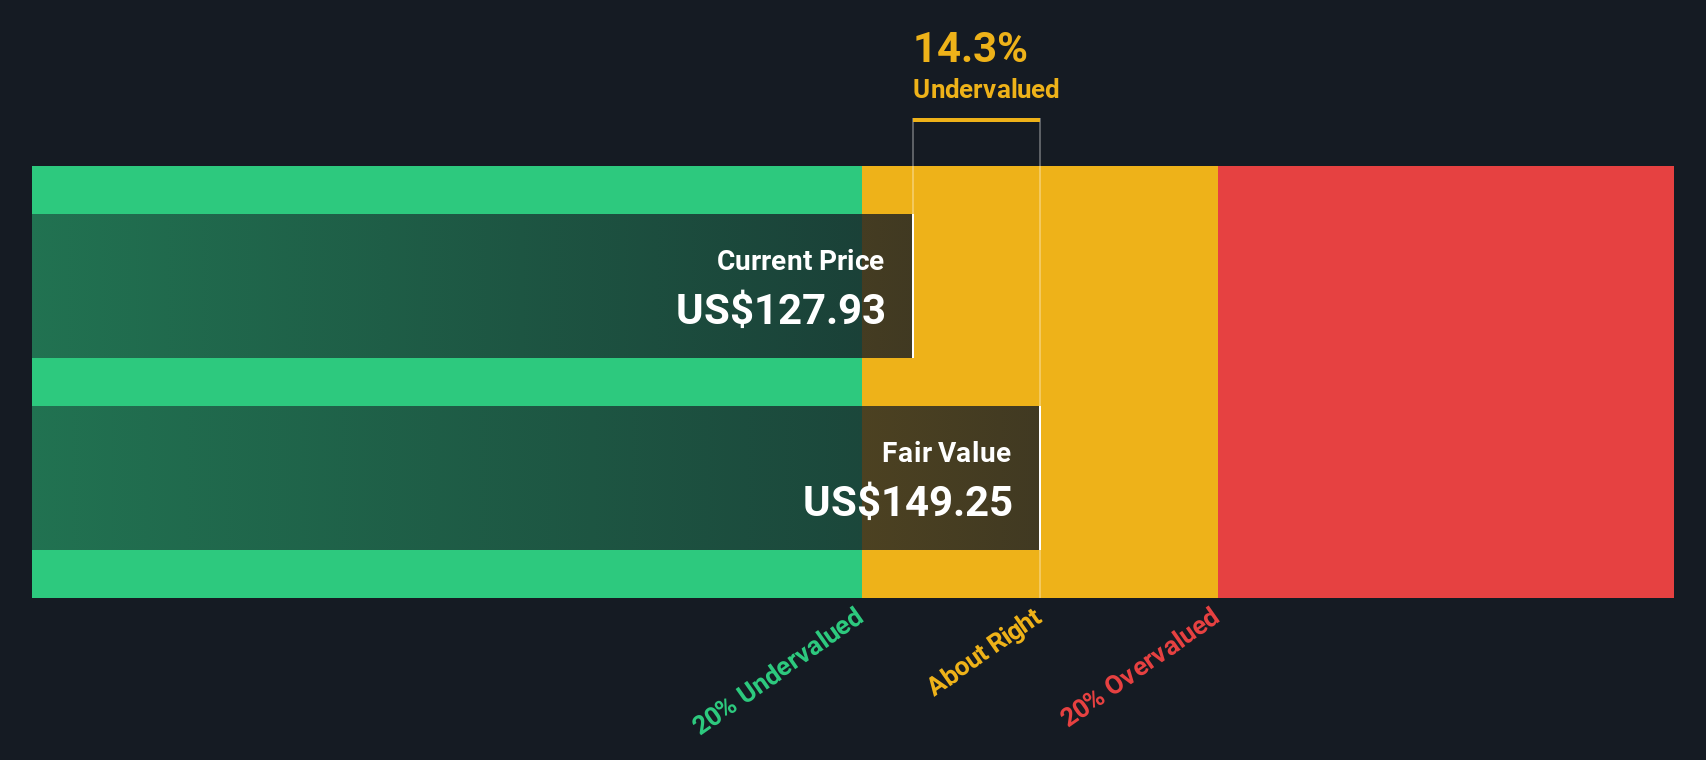
Our Discounted Cash Flow (DCF) analysis suggests Vertiv Holdings Co may be overvalued by 15.6%. Find undervalued stocks or create your own screener to find better value opportunities.
Approach 2: Vertiv Holdings Co Price vs Earnings
For profitable companies like Vertiv Holdings Co, the Price-to-Earnings (PE) ratio stands out as a widely accepted valuation metric. It connects the company’s market price to its actual earnings, making it a practical way for investors to judge how much they are paying per dollar of recent profit. The appropriate PE ratio depends on what investors expect in terms of growth and risk. Higher expected growth or lower perceived risk can justify a higher PE multiple, while lower growth or greater risks may warrant a lower one.
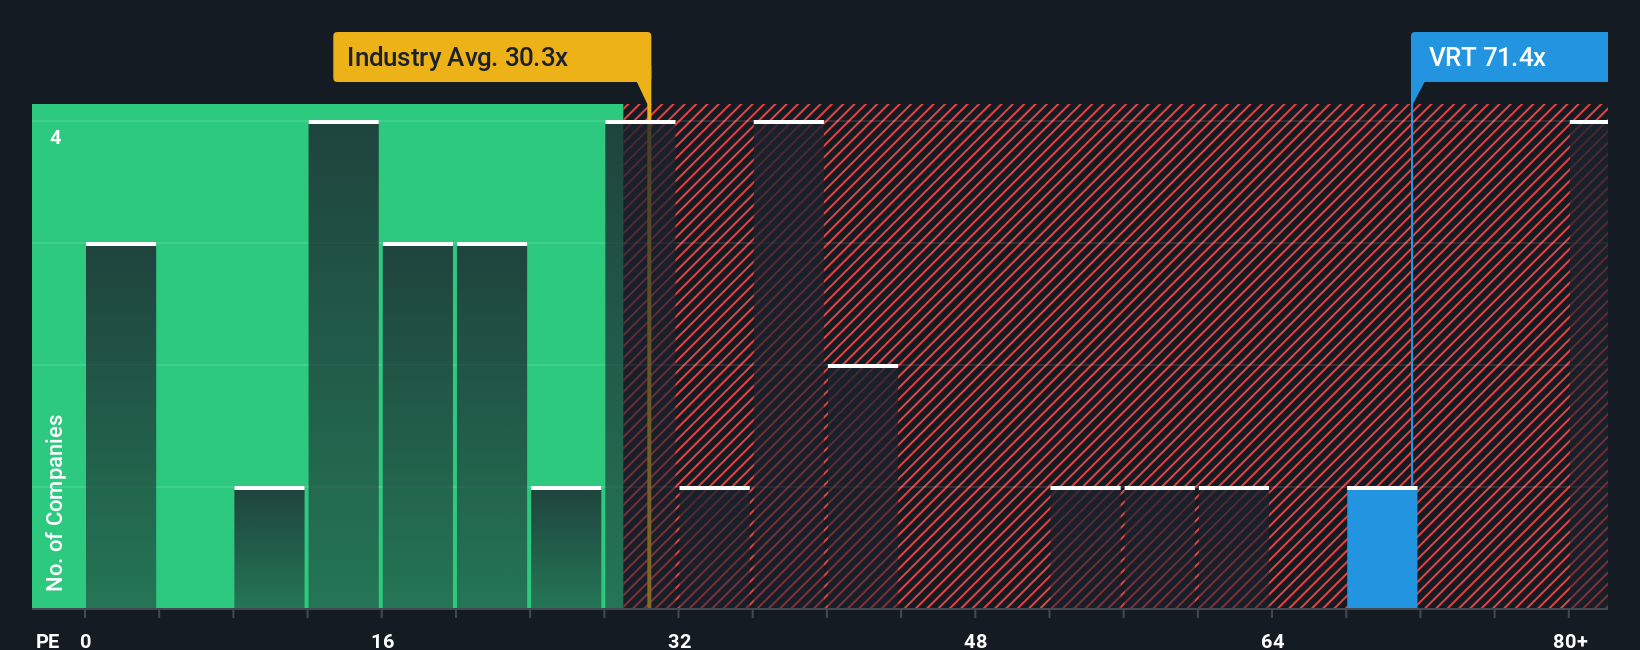
Currently, Vertiv trades at a PE ratio of 75.3x. This is more than double the Electrical industry average of 28.8x and is well above the peer group average of 35.4x. At first glance, this significant premium might suggest the stock is expensive, but looking at simple averages can be misleading for fast-growing or uniquely positioned companies.
This is where Simply Wall St’s “Fair Ratio” comes into play. The Fair Ratio for Vertiv is 64.4x, reflecting tailored analysis of its expected earnings growth, margins, industry structure, market capitalization, and risk profile. These are all factors that influence what a fair multiple should actually be. By considering more than just surface-level comparisons, the Fair Ratio aims to provide a more accurate benchmark for what Vertiv should be trading at given its particular strengths and risks.
Comparing Vertiv’s actual PE of 75.3x to its Fair Ratio of 64.4x, the stock does trade at a notable premium above what would be justified by these fundamentals. This suggests Vertiv shares are overvalued based on this approach.
Result: OVERVALUED
PE ratios tell one story, but what if the real opportunity lies elsewhere? Discover companies where insiders are betting big on explosive growth.
Upgrade Your Decision Making: Choose your Vertiv Holdings Co Narrative
Earlier, we mentioned there's an even better way to understand valuation, so let's introduce you to Narratives. A Narrative is simply your personal story about a company: how you think its future will unfold, what drives its business, and what those beliefs mean for things like revenue, margins, and fair value. Rather than relying solely on generic analyst targets or flat valuation ratios, a Narrative connects your view of Vertiv’s opportunities and challenges to a financial forecast and directly to a fair value.
Narratives are designed to be easy and accessible on Simply Wall St's Community page, where millions of investors build and share their viewpoints, each actively linking news, trends, and financial assumptions. This helps you decide when to buy or sell by comparing a dynamically updated Fair Value to today’s price, based on your own assumptions or those shared by the community. When new information comes out, Narratives and their calculated fair values instantly update with fresh data and insights.
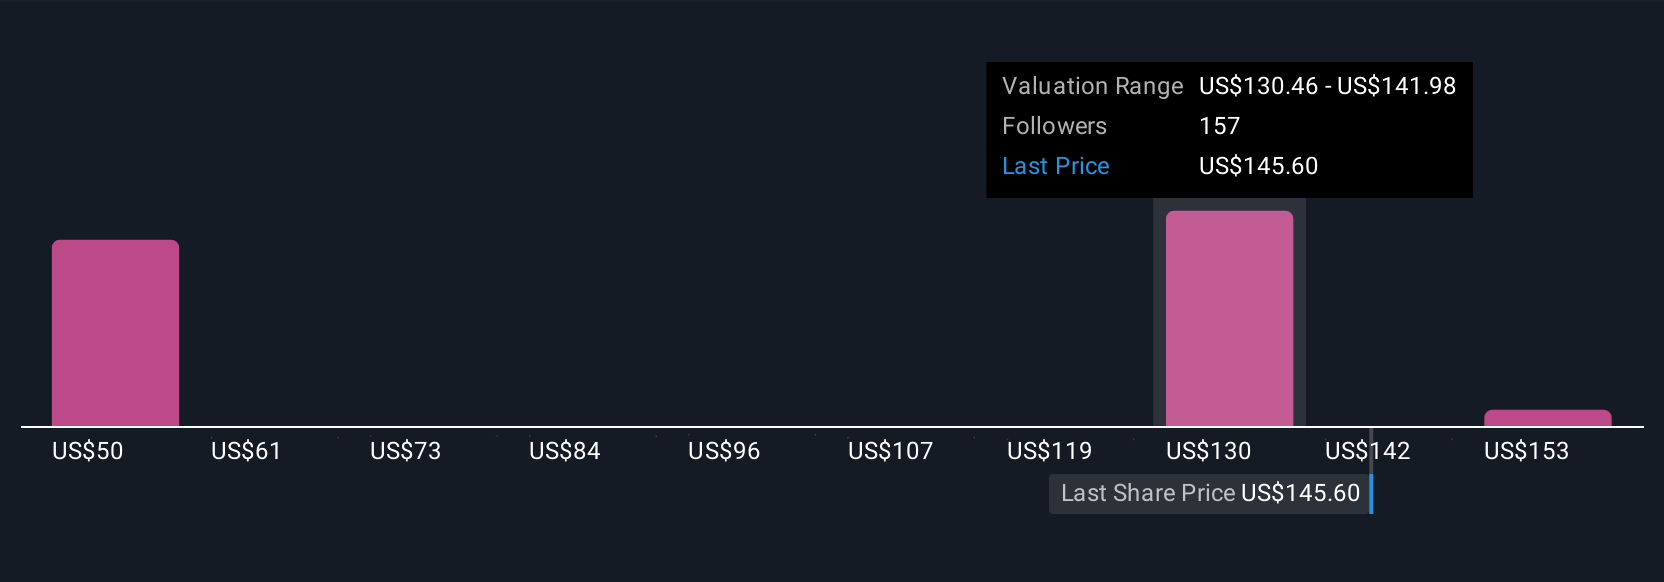
For Vertiv Holdings Co, Narratives in the Community highlight this power. The most bullish investors see a fair value as high as $173 based on aggressive data center growth and margin expansion, while the most cautious peg fair value at $119, citing margin risks and supply chain challenges. In a single view, you can understand what you’d need to believe for any price target and decide which story makes most sense for you.
Do you think there's more to the story for Vertiv Holdings Co? Create your own Narrative to let the Community know!
This article by Simply Wall St is general in nature. We provide commentary based on historical data and analyst forecasts only using an unbiased methodology and our articles are not intended to be financial advice. It does not constitute a recommendation to buy or sell any stock, and does not take account of your objectives, or your financial situation. We aim to bring you long-term focused analysis driven by fundamental data. Note that our analysis may not factor in the latest price-sensitive company announcements or qualitative material. Simply Wall St has no position in any stocks mentioned.
New: Manage All Your Stock Portfolios in One Place
We've created the ultimate portfolio companion for stock investors, and it's free.
• Connect an unlimited number of Portfolios and see your total in one currency
• Be alerted to new Warning Signs or Risks via email or mobile
• Track the Fair Value of your stocks
Have feedback on this article? Concerned about the content? Get in touch with us directly. Alternatively, email editorial-team@simplywallst.com
About NYSE:VRT
Vertiv Holdings Co
Designs, manufactures, and services critical digital infrastructure technologies and life cycle services for data centers, communication networks, and commercial and industrial environments in the Americas, the Asia Pacific, Europe, the Middle East, and Africa.
Flawless balance sheet with high growth potential.
Similar Companies
Market Insights

Advertisement
Community Narratives
The Next Phase of Energy Storage: How NeoVolta Is Tackling America’s Power Crunch
Fair Value US$7.50|35.1% undervalued
MA
Community Contributor
Why EnSilica is Worth Possibly 13x its Current Price
Fair Value UK£5.00|89.8% undervalued
DO
Community Contributor
M&A Activity, Industry Diversification & A Defense Contract Monopoly Will Push BWXT For Healthy Long-Term Growth
Fair Value US$220.00|15.2% undervalued
CL
Community Contributor
A case for Cassiar Gold Corp (TSXV: GLDC) to reach CAD$8-10 before 2030 (X30-37)
Fair Value CA$10.00|96.0% undervalued
AG
Community Contributor