Advertisement
- United States
- /
- Aerospace & Defense
- /
- NYSE:TXT
Is There an Opportunity in Textron After Recent Contract Wins and 33% Fair Value Gap?

Simply Wall St
Reviewed by Bailey Pemberton
If you are weighing what to do with Textron stock, you are not alone. With its share price closing at $82.58, Textron sits at the crossroads of investor curiosity and analyst debate. The stock’s journey—up just 0.1% over the past week, down 1.1% over the past month, and yet a robust 9.0% higher year-to-date—suggests a company that might be quietly positioning itself for its next move. Over the longer term, Textron’s performance is hard to ignore, boasting an impressive 28.4% gain over three years and a staggering 158.8% surge across five. Of course, the last 12 months have been less kind, with shares slipping 4.8%, a sign that shifting market sentiment and evolving industry narratives are very much in play.
What has kept Textron in conversation lately? While there have been no blockbuster events, the company’s recent headlines around key contract wins, operational expansions, and a steady drumbeat of innovation have reinforced its reputation as a diversified industrial powerhouse. These updates serve as subtle reminders that Textron’s business model can weather cycles and perhaps even take advantage of them.
When it comes to valuation, the numbers tell an optimistic story that’s hard to ignore. By our score, where each of six checks gives a point for signs of undervaluation, Textron earns a 5 out of 6. That is a strong signal to dig deeper. Let’s walk through the major valuation methods, compare what they reveal, and consider if there is an even better way to truly understand Textron’s worth.
Why Textron is lagging behind its peers
Approach 1: Textron Discounted Cash Flow (DCF) Analysis
The Discounted Cash Flow (DCF) model estimates a company's intrinsic value by projecting its future cash flows and discounting them back to today's dollars. This method helps investors gauge what a business is truly worth, beyond simple earnings multiples.
Textron's current Free Cash Flow stands at $527.2 million. Analysts have provided growth estimates reaching $1.232 billion in Free Cash Flow by 2029, with further projections beyond these years extrapolated by Simply Wall St. The company’s cash flow is expected to increase steadily over the coming decade, reflecting both consensus on Textron’s near-term momentum and estimates of its longer-term potential.
After running the numbers through a 2 Stage Free Cash Flow to Equity model, Textron’s fair value lands at $124.14 per share, compared to its current market price of $82.58. This implies the stock is trading at roughly a 33.5% discount to its calculated intrinsic value, a notable margin that suggests the market may be underestimating Textron’s future cash-generation power.
Result: UNDERVALUED
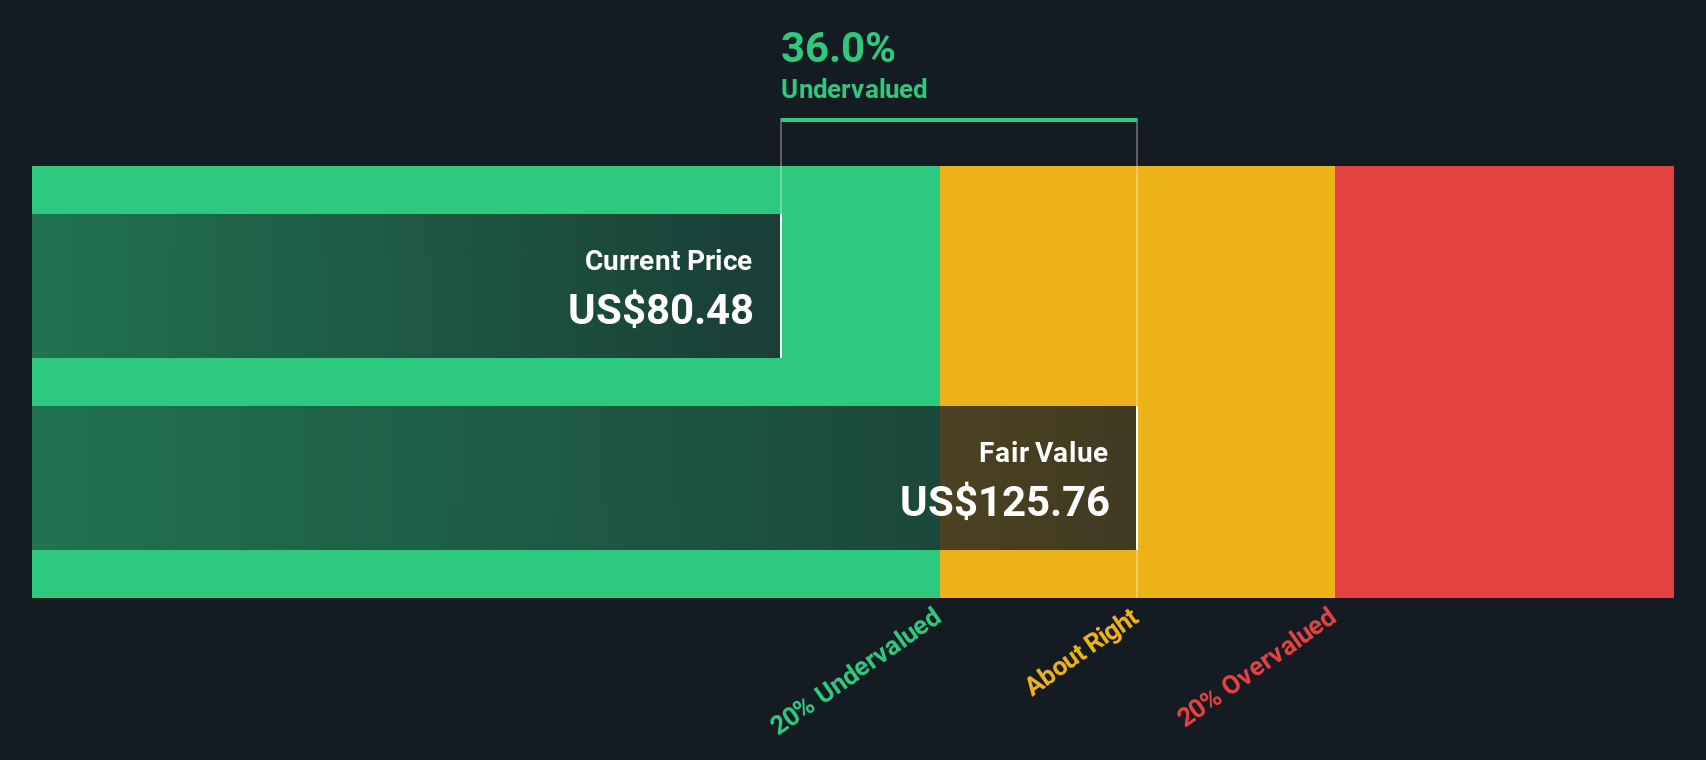
Our Discounted Cash Flow (DCF) analysis suggests Textron is undervalued by 33.5%. Track this in your watchlist or portfolio, or discover more undervalued stocks.
Approach 2: Textron Price vs Earnings
The Price-to-Earnings (PE) ratio is a practical and widely used valuation tool for profitable companies like Textron. It offers a straightforward way to compare a company's current share price to its net earnings, giving investors an immediate sense of how the market values each dollar of profit.
Generally, growth expectations and underlying business risks heavily influence what a "normal" or "fair" PE ratio should be. Fast-growing companies with stable earnings tend to command higher multiples, while those with uncertain prospects or higher risks usually trade at a discount.
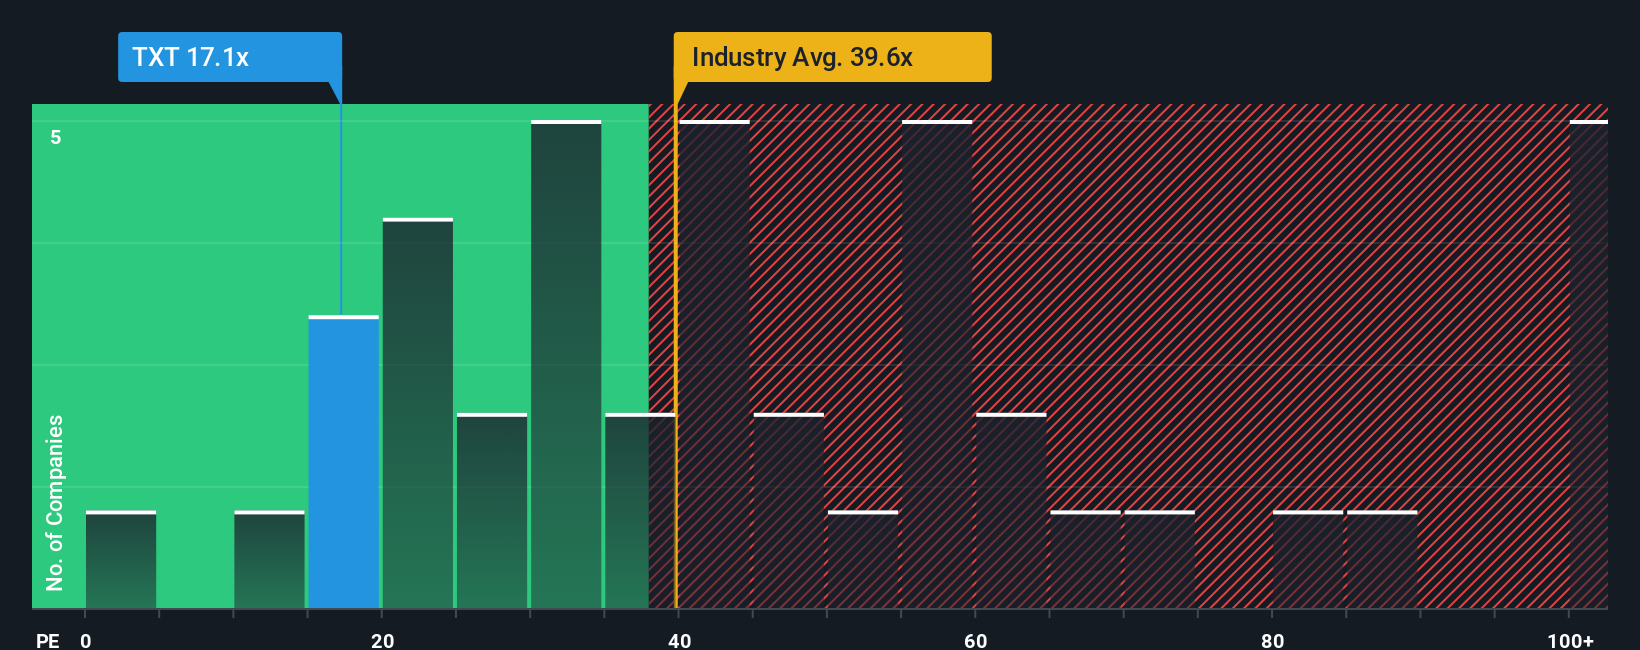
Textron currently trades at a PE ratio of 18.0x. For perspective, the Aerospace & Defense industry average is 37.8x, and Textron’s peer group averages an even higher 36.5x. This indicates that Textron is priced much more conservatively relative to the broader sector.
Simply Wall St’s proprietary "Fair Ratio" calculates what a reasonable PE should be by factoring in Textron’s specific earnings growth outlook, profit margins, industry, market cap, and risk characteristics. This approach offers a more tailored benchmark than simply looking at industry or peer averages, since it considers drivers unique to Textron’s business and market environment.
Textron’s Fair Ratio is estimated at 23.0x. With the company trading at 18.0x, this suggests shares are undervalued using this lens, presenting investors with a potential opportunity relative to its underlying fundamentals.
Result: UNDERVALUED
PE ratios tell one story, but what if the real opportunity lies elsewhere? Discover companies where insiders are betting big on explosive growth.
Upgrade Your Decision Making: Choose your Textron Narrative
Earlier, we mentioned that there is an even better way to understand valuation, so let’s introduce you to Narratives. A Narrative is simply your story, your perspective about how you believe Textron’s numbers will play out, including your assumptions for fair value, future revenue, earnings, and margins. It connects what you know about the company’s business, leadership, and market opportunities with actual financial forecasts and a calculated fair value, linking the company’s story directly to its expected future performance.
On Simply Wall St’s platform, millions of investors use Narratives as an accessible tool within the Community page to organize and act on their views. Narratives make it easy to spot opportunities: you can directly compare your Fair Value against Textron’s current price, helping you decide whether to buy, hold, or sell.
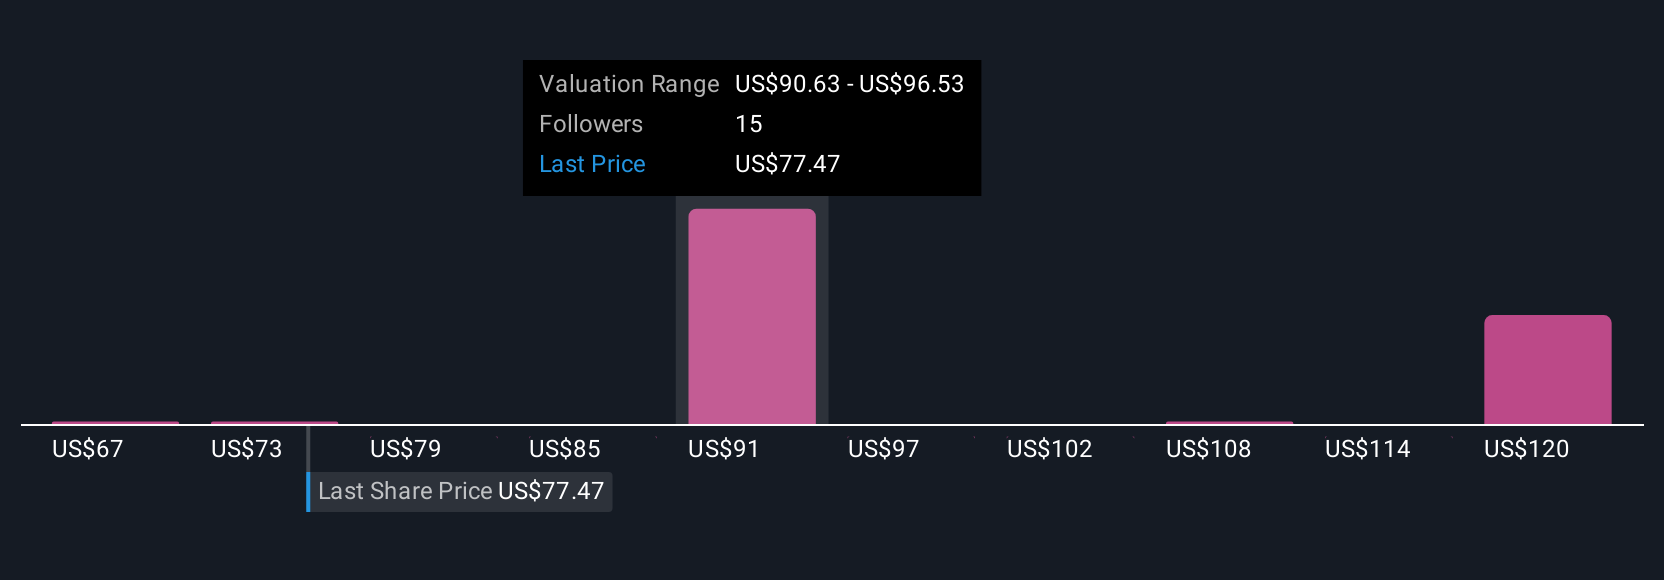
Best of all, Narratives update dynamically whenever fresh information, such as breaking news or new earnings, becomes available, ensuring your story reflects the latest facts. For example, some investors project a fair value for Textron as high as $107.00, seeing upside from new product launches and cost efficiencies. Others set it closer to $82.00, concerned about industry risks and margin pressures. Your Narrative is personal, powerful, and always in sync with a changing market.
Do you think there's more to the story for Textron? Create your own Narrative to let the Community know!
This article by Simply Wall St is general in nature. We provide commentary based on historical data and analyst forecasts only using an unbiased methodology and our articles are not intended to be financial advice. It does not constitute a recommendation to buy or sell any stock, and does not take account of your objectives, or your financial situation. We aim to bring you long-term focused analysis driven by fundamental data. Note that our analysis may not factor in the latest price-sensitive company announcements or qualitative material. Simply Wall St has no position in any stocks mentioned.
Valuation is complex, but we're here to simplify it.
Discover if Textron might be undervalued or overvalued with our detailed analysis, featuring fair value estimates, potential risks, dividends, insider trades, and its financial condition.
Access Free AnalysisHave feedback on this article? Concerned about the content? Get in touch with us directly. Alternatively, email editorial-team@simplywallst.com
About NYSE:TXT
Textron
Operates in the aircraft, defense, industrial, and finance businesses worldwide.
Flawless balance sheet and undervalued.
Similar Companies
Market Insights

Advertisement
Community Narratives
Finding The True Value Of A Logistics Powerhouse
Fair Value US$95.21|8.5% undervalued
NV
Community Contributor
Paradigm Biopharmaceuticals Will Lead Osteoarthritis Treatment with Zilosul's FDA Success
Fair Value AU$5.50|91.8% undervalued
AM
Community Contributor
Barrick Mining (ABX:CA): A Gold Hedge against a U.S. Shutdown
Fair Value CA$60.00|26.5% undervalued
GM
Community Contributor