Advertisement
- United States
- /
- Machinery
- /
- NYSE:TRN
Trinity Industries (TRN): Margin Decline Raises Questions on Quality of Recent Earnings Growth

Simply Wall St
Reviewed by Simply Wall St
Trinity Industries (TRN) reported revenue growth is forecast at 7.3% per year, trailing the broader US market’s pace of 10.3%. Net profit margins narrowed to 4.3% from 5.4% last year, marking a dip in profitability, even as five-year annualized earnings growth landed at 60.8%. However, this latest period benefited from a one-off $51.0 million gain. With shares trading at $27.05, below the estimated fair value of $32.12 and a Price-to-Earnings ratio of 20.1x, investors are weighing the impact of non-recurring income and thinner margins against an apparently undervalued stock.
See our full analysis for Trinity Industries.The next section puts Trinity’s numbers side by side with the most widely followed narratives, highlighting where expectations and reality align, and where the story might need a second look.
See what the community is saying about Trinity Industries
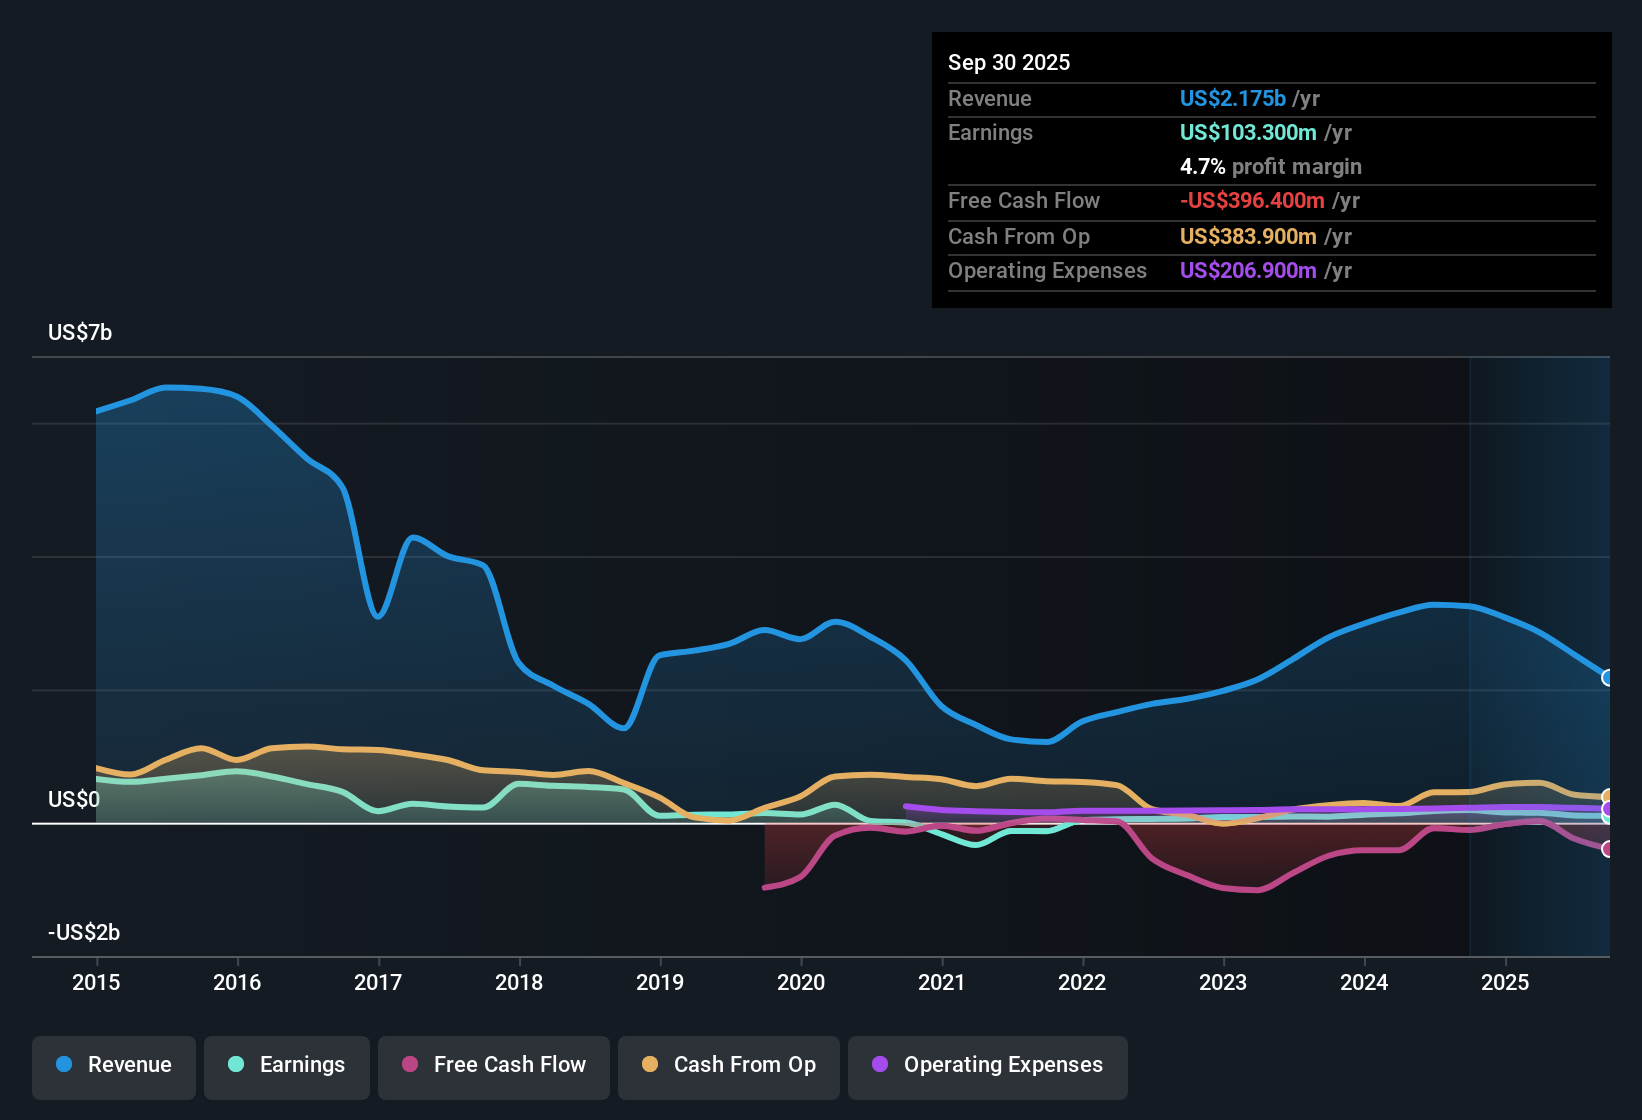
Profit Margins Dip While Analysts Expect a 3.6 Point Recovery
- The current net profit margin stands at 4.3%, down notably from the previous year's 5.4%. This suggests profitability is under pressure even after a one-off $51.0 million gain boosted headline numbers.
- Analysts' consensus view highlights a key tension: they predict profit margins will grow to 7.9% over the next three years,
- even as today's actual margin is markedly below both this target and prior-year performance, putting the burden on market recovery and management's cost discipline,
- while recent margin compression challenges the idea that operating leverage alone will deliver the expected rebound without a significant volume upturn.
- For investors watching profitability and how the outlook lines up with the numbers, see how consensus thinks the story fits together in their full take: 📊 Read the full Trinity Industries Consensus Narrative.
One-Off Gains Distort Five-Year Earnings Growth Story
- Trinity’s five-year annualized earnings growth of 60.8% is skewed by a material $51.0 million non-recurring gain in the most recent period. This complicates any read-through to sustainable trends.
- Analysts' consensus view points to improved recurring cash flows and higher operating leverage as volume returns,
- but the outsize impact of portfolio gains, rather than core business strength, means headline growth numbers risk overstating the real pace of business improvement,
- and continued reliance on these gains for future earnings could mask softness in core railcar manufacturing and leasing segments.
Trading Below DCF Fair Value, But Rated Expensive Versus Peers
- Shares are priced at $27.05, which sits below the DCF fair value of $32.12. However, the 20.1x Price-to-Earnings ratio is above direct peers' 19.3x average, even while remaining cheaper than the broader US Machinery industry's 24.6x.
- According to the analysts' consensus view, the narrow 1.2% gap between the current price and their $30.00 target suggests limited near-term upside,
- even as the DCF valuation signals more room to run if company fundamentals stabilize,
- and the stronger sector valuation may offer a cushion if Trinity can deliver on the expected margin recovery and enhanced return on equity.
Next Steps
To see how these results tie into long-term growth, risks, and valuation, check out the full range of community narratives for Trinity Industries on Simply Wall St. Add the company to your watchlist or portfolio so you'll be alerted when the story evolves.
Have a fresh take on the numbers? Put your perspective to the test and build your own narrative in just minutes with: Do it your way
A great starting point for your Trinity Industries research is our analysis highlighting 1 key reward and 3 important warning signs that could impact your investment decision.
See What Else Is Out There
Trinity Industries’ profit margins have shrunk, and recent growth was fueled by one-off gains. This raises questions about the consistency and reliability of future earnings.
If steadier performance is what you want, focus on stable growth stocks screener (2112 results) to identify companies with proven track records of strong, consistent growth through varying market cycles.
This article by Simply Wall St is general in nature. We provide commentary based on historical data and analyst forecasts only using an unbiased methodology and our articles are not intended to be financial advice. It does not constitute a recommendation to buy or sell any stock, and does not take account of your objectives, or your financial situation. We aim to bring you long-term focused analysis driven by fundamental data. Note that our analysis may not factor in the latest price-sensitive company announcements or qualitative material. Simply Wall St has no position in any stocks mentioned.
Valuation is complex, but we're here to simplify it.
Discover if Trinity Industries might be undervalued or overvalued with our detailed analysis, featuring fair value estimates, potential risks, dividends, insider trades, and its financial condition.
Access Free AnalysisHave feedback on this article? Concerned about the content? Get in touch with us directly. Alternatively, email editorial-team@simplywallst.com
About NYSE:TRN
Trinity Industries
Provides railcar products and services under the TrinityRail trade name in North America.
Average dividend payer with low risk.
Similar Companies
Market Insights

Advertisement
Community Narratives
The company that turned a verb into a global necessity and basically runs the modern internet, digital ads, smartphones, maps, and AI.
Fair Value US$300.00|6.2% undervalued
OS
Community Contributor
Flowers Foods Pays A Fair Price For Health
Fair Value US$16.12|25.1% undervalued
NV
Community Contributor
TMX Group will thrive with 33.3% profit margin and enduring market moat
Fair Value CA$49.90|0.04% overvalued
LI
Community Contributor