Advertisement
- United States
- /
- Aerospace & Defense
- /
- NYSE:RTX
Assessing RTX Stock After Its 54% Rally and New Technology Investment Announcements

Simply Wall St
Reviewed by Bailey Pemberton
Trying to decide what to do with RTX stock right now? You’re not alone, and there’s a lot to unpack. RTX has been on an eye-catching run, up 13.1% in the past week and already soaring 54.0% year-to-date. That kind of momentum gets investors, long-timers and newcomers alike, sitting up and paying attention.
What’s fueling all this upward energy? Along with a renewed focus on aerospace and defense that’s lifting the entire sector, RTX’s recent announcements around technology upgrades and long-term platform investments seem to have rekindled confidence. There is a clear sense in the market that RTX is well-positioned for demand in both commercial and defense applications. Of course, we shouldn’t ignore the 270.1% return over five years; it is not just a short-term pop, but a story of sustained growth, with recent gains echoing the positive sentiment from the last several years.
But soaring price tags bring questions about valuation. Here is where it gets interesting. Our scorecard, using six different undervaluation checks, assigns RTX a value score of just 1 out of 6. That suggests plenty of folks are wondering if the stock is starting to look a little expensive, given how much optimism is already priced in.
So, how should you think about RTX’s valuation? Let’s dig into the numbers using each key method, and then, at the end, we’ll talk about a smarter, more comprehensive way to value a stock like this.
RTX scores just 1/6 on our valuation checks. See what other red flags we found in the full valuation breakdown.
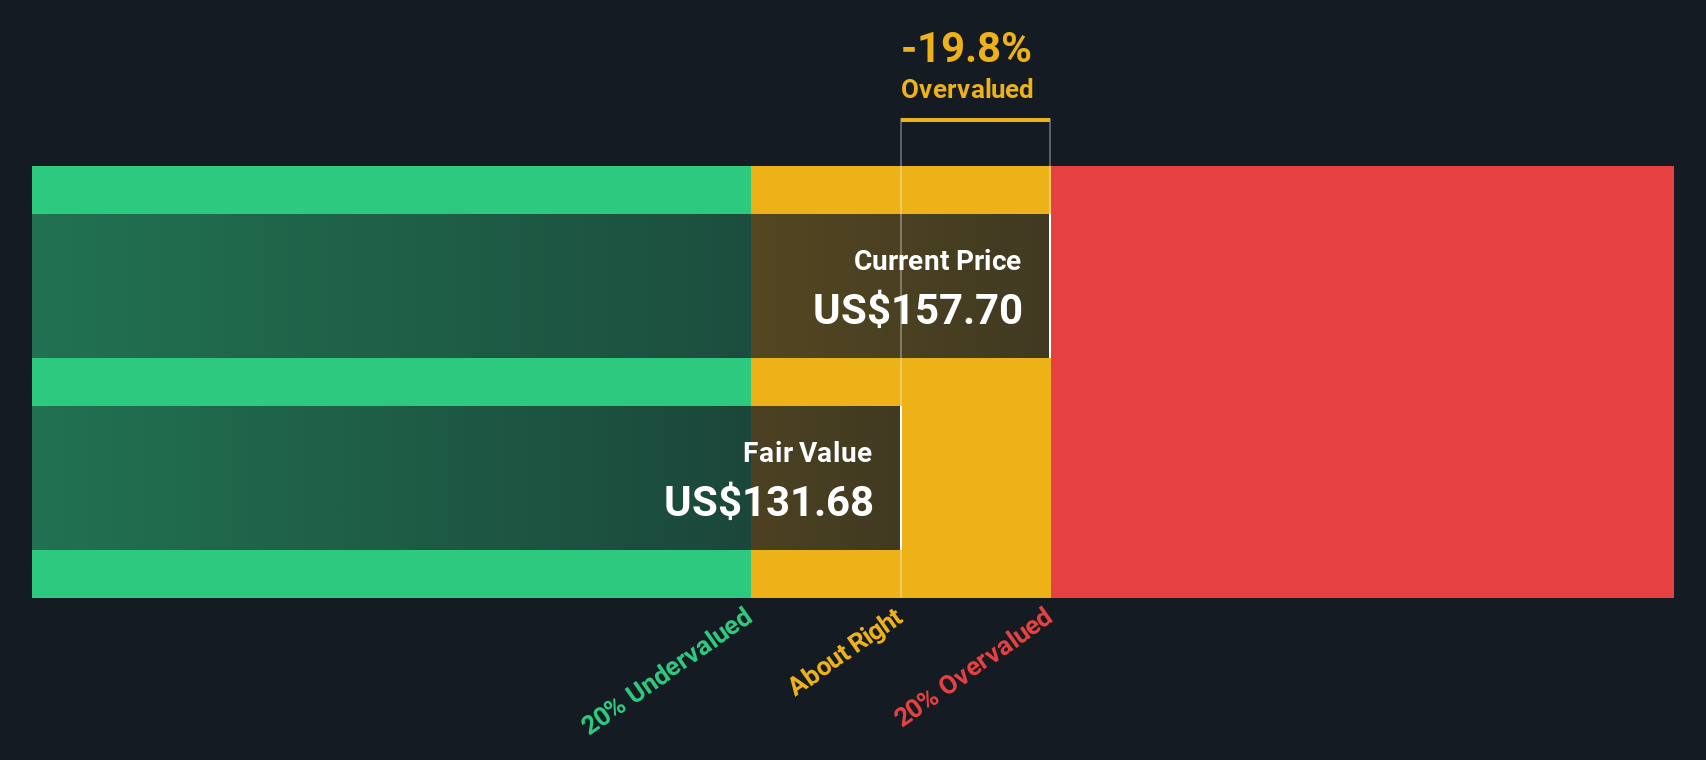
Approach 1: RTX Discounted Cash Flow (DCF) Analysis
The Discounted Cash Flow (DCF) model estimates the intrinsic value of a company by projecting its future cash flows and then discounting those cash flows back to today's value. This method helps assess what the business is really worth, independent of short-term market swings.
For RTX, the latest reported Free Cash Flow stands at $4.47 Billion. According to analysts, this figure is expected to climb over the coming years, with forecasts reaching $10.77 Billion by 2029. While analysts typically provide estimates for up to five years, projections beyond that point, such as out to ten years, are based on reasonable growth assumptions and extrapolations.
When these future cash flows are discounted to present value using a 2 Stage Free Cash Flow to Equity model, the resulting estimated fair value for RTX is $135.89 per share. However, the current market price suggests RTX is trading at a 31.5% premium to this intrinsic value, meaning the stock is considered significantly overvalued by this metric.
Result: OVERVALUED
Our Discounted Cash Flow (DCF) analysis suggests RTX may be overvalued by 31.5%. Find undervalued stocks or create your own screener to find better value opportunities.
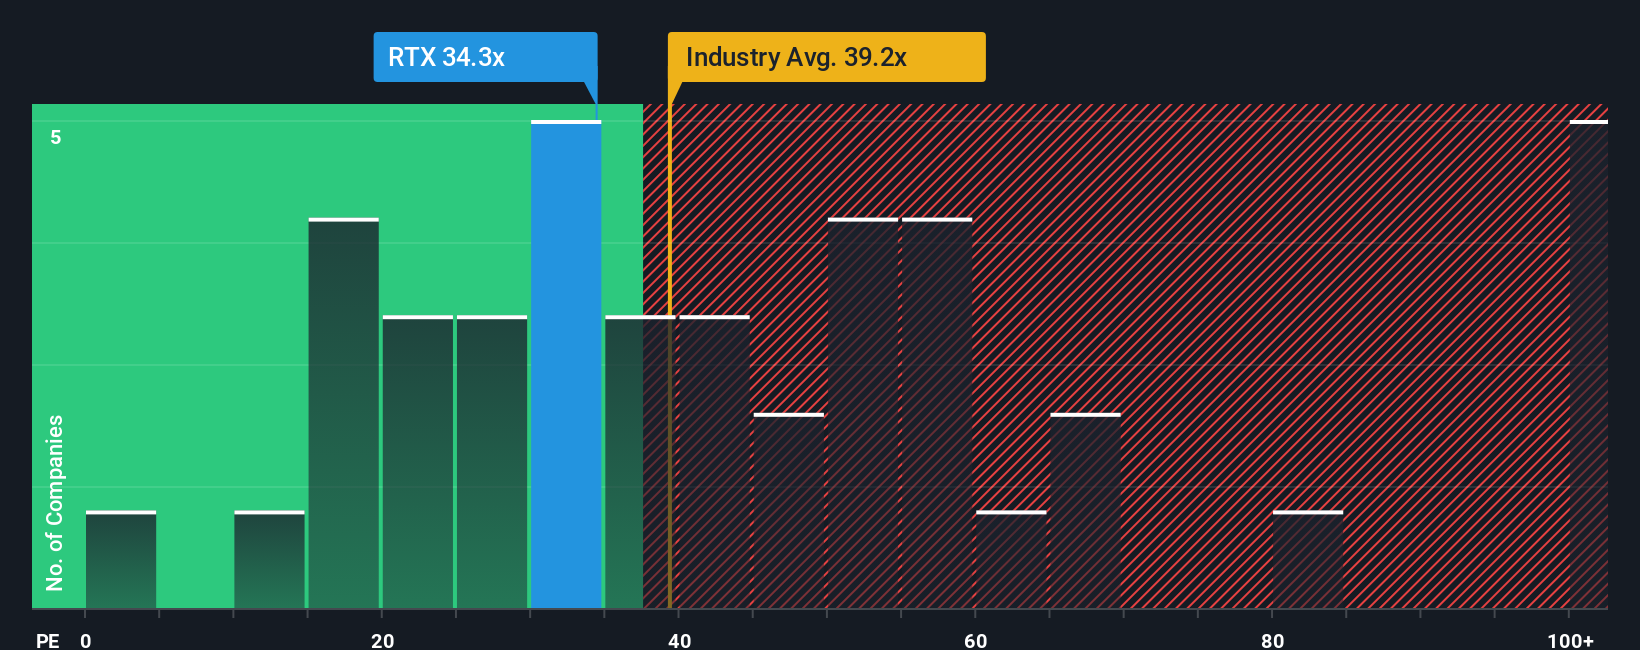
Approach 2: RTX Price vs Earnings
The Price-to-Earnings (PE) ratio is a go-to valuation metric for profitable companies like RTX. It gives investors a simple way to gauge how much they are paying for each dollar of earnings. The higher the growth outlook or the lower the perceived risks, the more investors are typically willing to pay, often leading to a higher "normal" or "fair" PE ratio for such companies.
RTX currently trades at a PE ratio of 36.3x. To put this in perspective, the average PE ratio across its immediate peers comes in at 27.8x, while the broader Aerospace & Defense industry average sits even higher at 40.0x. Based on proprietary analysis by Simply Wall St, RTX’s Fair Ratio, which considers factors like expected earnings growth, profit margins, market cap and risk unique to RTX, is assessed at 34.3x.
The Fair Ratio is designed to be more comprehensive than a simple comparison with industry or peer averages, incorporating a wide spectrum of business dynamics. This includes everything from company-specific growth prospects and profitability, to the business’s weight in the market and exposure to risk. By bringing all these elements together, the Fair Ratio offers a more accurate benchmark, helping investors understand whether a stock’s earnings multiple is justified.
Comparing RTX’s current PE of 36.3x to its Fair Ratio of 34.3x, the gap is not dramatic but leans slightly toward overvaluation.
Result: OVERVALUED
PE ratios tell one story, but what if the real opportunity lies elsewhere? Discover companies where insiders are betting big on explosive growth.
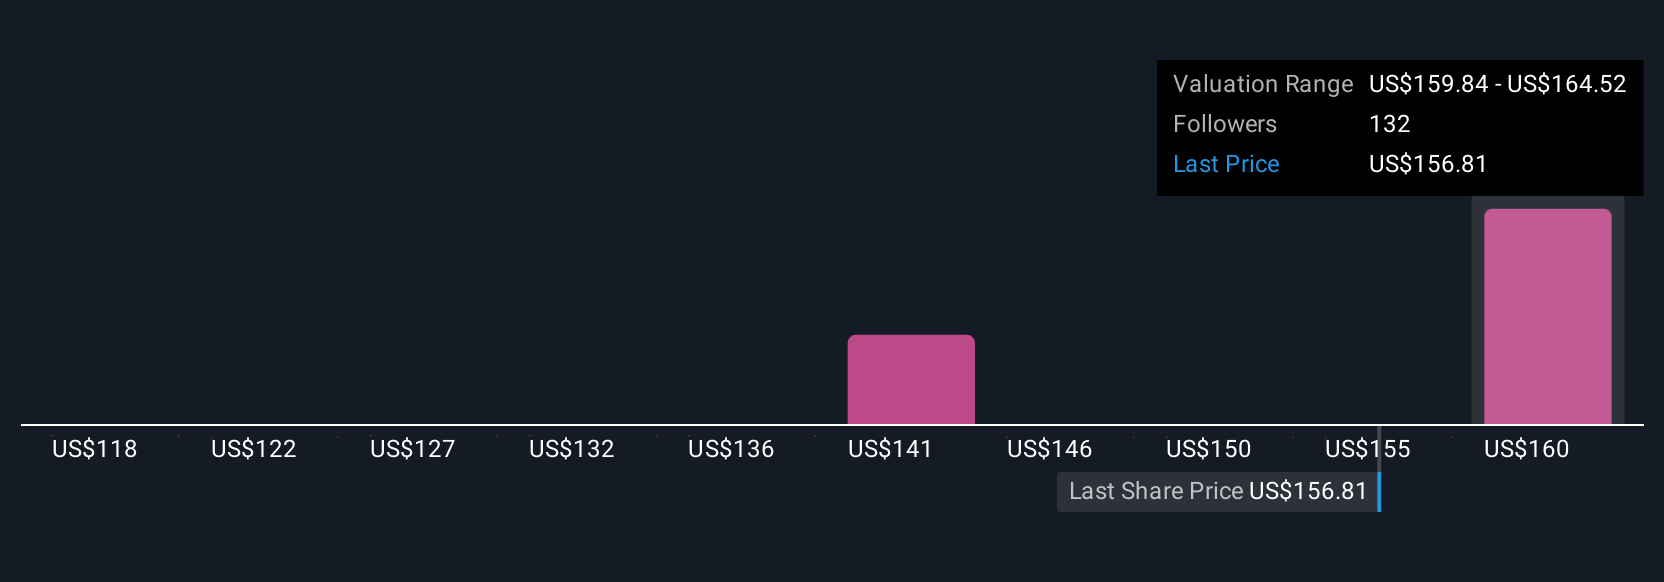
Upgrade Your Decision Making: Choose your RTX Narrative
Earlier we touched on finding a better way to understand valuation, so let’s introduce Narratives, a smarter, more accessible approach to investing that goes beyond just numbers. A Narrative is a simple but powerful tool that allows you to tell your own story about a company by combining your perspective with forecasts for future revenue, earnings, and margins. This ultimately leads to your view of fair value. Narratives directly connect what you believe about a company, whether it is growth potential, risk factors, or market trends, with an actual financial forecast, making your investment approach more personal and transparent.
Available on Simply Wall St’s Community page, Narratives are designed so anyone can build, update, and share their views with millions of other investors. They make it easy to see how your fair value estimate compares to current share prices, helping you decide when to buy or sell based on your own analysis, not just consensus or momentum. In addition, Narratives are automatically updated whenever fresh information such as news or earnings arrives, so your assumptions and fair value stay relevant in real time.
For example, with RTX, one investor might be bullish, focusing on robust defense contracts and forecasting future value as high as $180 per share, while another investor who is more cautious about supply chain risks might see fair value closer to $134. This shows how much perspectives can differ even when using the same data.
Do you think there's more to the story for RTX? Create your own Narrative to let the Community know!
This article by Simply Wall St is general in nature. We provide commentary based on historical data and analyst forecasts only using an unbiased methodology and our articles are not intended to be financial advice. It does not constitute a recommendation to buy or sell any stock, and does not take account of your objectives, or your financial situation. We aim to bring you long-term focused analysis driven by fundamental data. Note that our analysis may not factor in the latest price-sensitive company announcements or qualitative material. Simply Wall St has no position in any stocks mentioned.
New: AI Stock Screener & Alerts
Our new AI Stock Screener scans the market every day to uncover opportunities.
• Dividend Powerhouses (3%+ Yield)
• Undervalued Small Caps with Insider Buying
• High growth Tech and AI Companies
Or build your own from over 50 metrics.
Have feedback on this article? Concerned about the content? Get in touch with us directly. Alternatively, email editorial-team@simplywallst.com
About NYSE:RTX
RTX
An aerospace and defense company, provides systems and services for the commercial, military, and government customers in the United States and internationally.
Solid track record with adequate balance sheet and pays a dividend.
Similar Companies
Market Insights

Advertisement
Community Narratives
Finding The True Value Of A Logistics Powerhouse
Fair Value US$95.21|8.4% undervalued
NV
Community Contributor
Paradigm Biopharmaceuticals Will Lead Osteoarthritis Treatment with Zilosul's FDA Success
Fair Value AU$5.50|92.1% undervalued
AM
Community Contributor
Barrick Mining (ABX:CA): A Gold Hedge against a U.S. Shutdown
Fair Value CA$60.00|24.2% undervalued
GM
Community Contributor