
Advertisement
- United States
- /
- Electrical
- /
- NYSE:ROK
Despite Its High P/E Ratio, Is Rockwell Automation, Inc. (NYSE:ROK) Still Undervalued?

This article is written for those who want to get better at using price to earnings ratios (P/E ratios). We'll look at Rockwell Automation, Inc.'s (NYSE:ROK) P/E ratio and reflect on what it tells us about the company's share price. Rockwell Automation has a price to earnings ratio of 24.63, based on the last twelve months. That is equivalent to an earnings yield of about 4.1%.
View our latest analysis for Rockwell Automation
How Do I Calculate Rockwell Automation's Price To Earnings Ratio?
The formula for P/E is:
Price to Earnings Ratio = Price per Share ÷ Earnings per Share (EPS)
Or for Rockwell Automation:
P/E of 24.63 = $169.93 ÷ $6.9 (Based on the trailing twelve months to December 2018.)
Is A High P/E Ratio Good?
A higher P/E ratio means that investors are paying a higher price for each $1 of company earnings. All else being equal, it's better to pay a low price -- but as Warren Buffett said, 'It's far better to buy a wonderful company at a fair price than a fair company at a wonderful price.'
How Growth Rates Impact P/E Ratios
When earnings fall, the 'E' decreases, over time. Therefore, even if you pay a low multiple of earnings now, that multiple will become higher in the future. Then, a higher P/E might scare off shareholders, pushing the share price down.
Rockwell Automation increased earnings per share by a whopping 137% last year. But earnings per share are down 5.8% per year over the last five years.
How Does Rockwell Automation's P/E Ratio Compare To Its Peers?
The P/E ratio essentially measures market expectations of a company. You can see in the image below that the average P/E (15.5) for companies in the electrical industry is lower than Rockwell Automation's P/E.
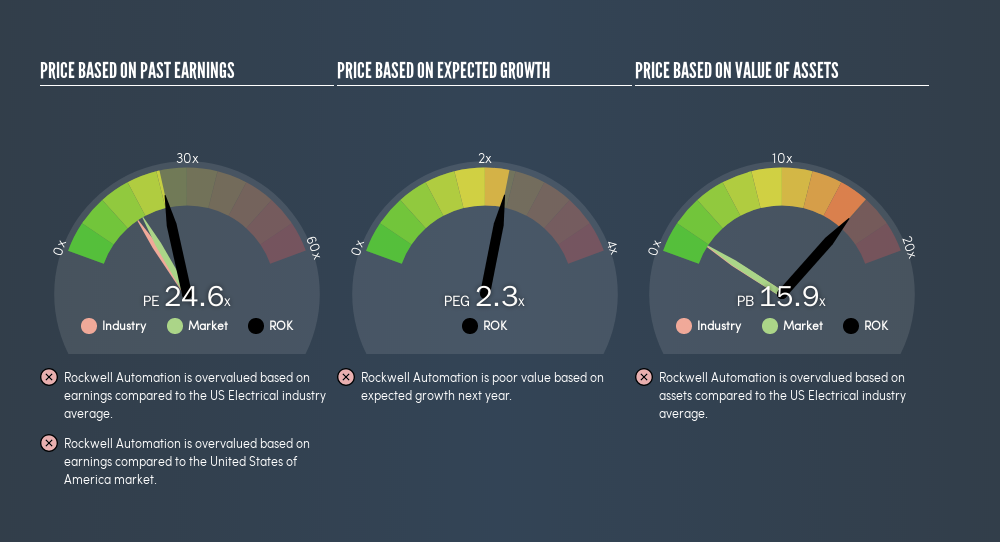
That means that the market expects Rockwell Automation will outperform other companies in its industry. Shareholders are clearly optimistic, but the future is always uncertain. So investors should delve deeper. I like to check if company insiders have been buying or selling.
A Limitation: P/E Ratios Ignore Debt and Cash In The Bank
The 'Price' in P/E reflects the market capitalization of the company. Thus, the metric does not reflect cash or debt held by the company. Theoretically, a business can improve its earnings (and produce a lower P/E in the future), by taking on debt (or spending its remaining cash).
Such expenditure might be good or bad, in the long term, but the point here is that the balance sheet is not reflected by this ratio.
Is Debt Impacting Rockwell Automation's P/E?
Rockwell Automation has net debt worth just 5.5% of its market capitalization. It would probably trade on a higher P/E ratio if it had a lot of cash, but I doubt it is having a big impact.
The Verdict On Rockwell Automation's P/E Ratio
Rockwell Automation's P/E is 24.6 which is above average (17.2) in the US market. Its debt levels do not imperil its balance sheet and it has already proven it can grow. So it does not seem strange that the P/E is above average.
Investors should be looking to buy stocks that the market is wrong about. If the reality for a company is better than it expects, you can make money by buying and holding for the long term. So this freereport on the analyst consensus forecasts could help you make a master move on this stock.
You might be able to find a better buy than Rockwell Automation. If you want a selection of possible winners, check out this freelist of interesting companies that trade on a P/E below 20 (but have proven they can grow earnings).
We aim to bring you long-term focused research analysis driven by fundamental data. Note that our analysis may not factor in the latest price-sensitive company announcements or qualitative material.
If you spot an error that warrants correction, please contact the editor at editorial-team@simplywallst.com. This article by Simply Wall St is general in nature. It does not constitute a recommendation to buy or sell any stock, and does not take account of your objectives, or your financial situation. Simply Wall St has no position in the stocks mentioned. Thank you for reading.
About NYSE:ROK
Rockwell Automation
Provides industrial automation and digital transformation solutions in North America, Europe, the Middle East, Africa, the Asia Pacific, and Latin America.
Established dividend payer with adequate balance sheet.
Similar Companies
Market Insights


Advertisement
Community Narratives
The Future of Drug Testing? Fingerprint Tech Shows Serious Promise
Fair Value US$2.98|40.3% undervalued
JO
Community Contributor
Suncorp’s Next Chapter: Insurance-Only and Ready to Grow
Fair Value AU$22.83|7.9% undervalued
RO
Community Contributor
Thyssenkrupp Nucera Will Achieve Double-Digit Profits by 2030 Boosted by Hydrogen Growth
Fair Value €14.40|31.6% undervalued
CH
Community Contributor
Tesla’s Nvidia Moment – The AI & Robotics Inflection Point
Fair Value US$359.72|12.3% undervalued
BL
Community Contributor