Advertisement
- United States
- /
- Aerospace & Defense
- /
- NYSE:NOC
Is Northrop Grumman Fairly Priced After Recent Growth in Autonomous Systems?

Simply Wall St
Reviewed by Bailey Pemberton
Trying to decide what to do with Northrop Grumman stock right now? You’re not alone. Whether you’re a long-time holder or sizing up your first buy, it takes a steady hand and a little curiosity to navigate these defense industry giants. Let’s be honest, Northrop’s share price has taken investors on a short-term roller coaster. Over the past week, the stock ticked down by 1.0%. If you zoom out to the past five years, you’re looking at a hefty 118.3% return. Those numbers alone suggest there’s been meaningful growth, even if the past month saw only a modest 0.2% uptick.
Behind these moves, a combination of geopolitical shifts and renewed government contracts has kept the spotlight firmly on Northrop. This year, their year-to-date performance is up an impressive 27.3%. It’s not just about war headlines. There’s a real sense that investors are pricing in Northrop’s long-term relevance and its knack for securing key defense contracts. Recent news has focused on developments within autonomous systems and hypersonic technologies, both areas where Northrop is a recognized innovator. That innovation angle consistently draws institutional interest and may soften any risk perceptions baked into the stock price.
As for valuation, Northrop sits comfortably in the middle of the pack, acing 3 out of 6 major valuation checks for a value score of 3. But do those metrics really tell the full story? In the next section, we’ll break down what each of those checks actually means and take a closer look at the numbers behind them. Before we’re done, I’ll even share a perspective on company valuation that goes well beyond the typical checklist approach.
Why Northrop Grumman is lagging behind its peers
Approach 1: Northrop Grumman Discounted Cash Flow (DCF) Analysis
The Discounted Cash Flow (DCF) model estimates a company’s intrinsic value by forecasting its future cash flows and discounting them back to today’s value. This approach helps determine what the business is truly worth based on its ability to generate cash in the years ahead.
For Northrop Grumman, the DCF model starts with its current Free Cash Flow, which sits at $1.75 Billion. Analysts provide specific projections for the next five years, and according to these estimates, Free Cash Flow rises steadily, reaching $3.86 Billion by 2029. From there, projections extend further out, with Simply Wall St extrapolating growth up to $4.79 Billion by 2035. This consistent cash flow expansion fuels the company’s value estimate today.
Based on these calculations, the DCF model assigns Northrop Grumman an intrinsic value of $499.22 per share. However, when compared to the company’s current share price, this intrinsic value suggests the stock is about 19.4% overvalued. This means investors are paying a premium for the shares at today’s prices.
Result: OVERVALUED
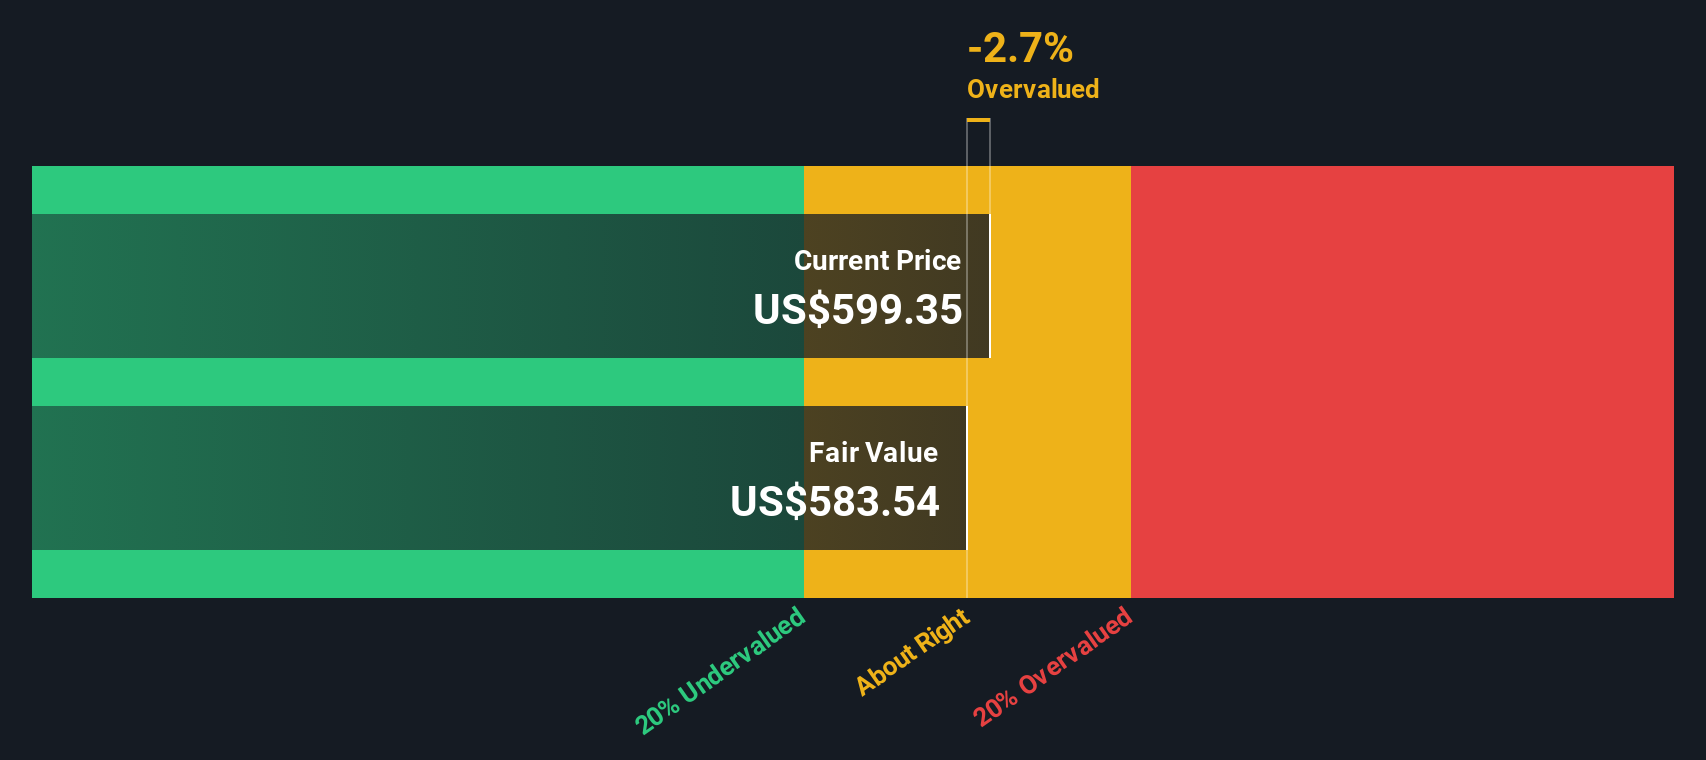
Our Discounted Cash Flow (DCF) analysis suggests Northrop Grumman may be overvalued by 19.4%. Find undervalued stocks or create your own screener to find better value opportunities.
Approach 2: Northrop Grumman Price vs Earnings
For a profitable company like Northrop Grumman, the Price-to-Earnings (PE) ratio is one of the most commonly used and useful valuation metrics. The PE ratio helps investors gauge how much they are paying for each dollar of the company’s earnings, which is especially helpful when those earnings are stable and growing. Generally, higher PE ratios can be justified by strong growth expectations or lower risk. Lower PE ratios might point to slower growth or greater uncertainty.
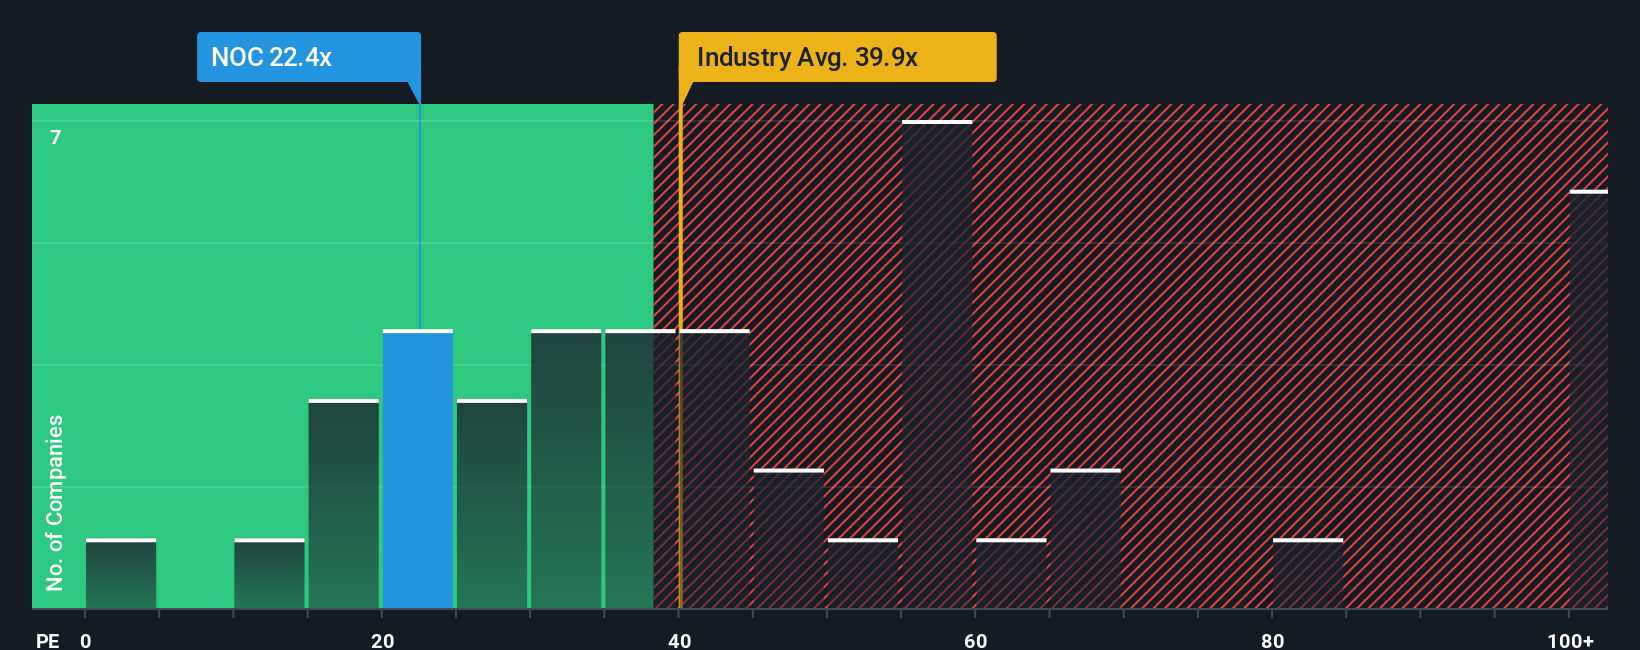
Northrop Grumman currently trades at a PE ratio of 21.2x. When comparing this to the Aerospace and Defense industry average of 40.9x and the peer average of 37.8x, Northrop appears more modestly priced on an earnings basis. However, simple comparisons like these can miss company-specific details. That is where the “Fair Ratio” comes in. According to Simply Wall St’s proprietary analysis, which considers growth prospects, profit margins, risk factors, industry dynamics, and market cap, Northrop’s Fair PE Ratio is 26.2x.
The Fair Ratio is a more tailored benchmark than industry or peer averages because it incorporates what actually drives a company’s value, instead of assuming all companies in a sector are created equal. In Northrop’s case, its current PE of 21.2x comes in below its Fair Ratio of 26.2x, suggesting the stock is trading at a discount versus what might be considered justified based on its fundamentals and outlook.
Result: UNDERVALUED
PE ratios tell one story, but what if the real opportunity lies elsewhere? Discover companies where insiders are betting big on explosive growth.
Upgrade Your Decision Making: Choose your Northrop Grumman Narrative
Earlier we mentioned there is an even better way to understand valuation, so let’s introduce you to Narratives. A Narrative is simply your story about a company, your personal view of where it is headed, why, and what numbers most matter for its future. Narratives connect the company’s strategy and industry context directly to financial forecasts like expected revenue, profit margins, and what you believe is a “fair” value for the stock.
Instead of just looking at ratios, Narratives let you combine your perspective with dynamic, up-to-date financial data so you can see how your story stacks up against the current price. On Simply Wall St’s Community page, you can easily build your own Northrop Grumman Narrative, compare it to others, and see how millions of investors are thinking, making it accessible no matter your investing experience.
Narratives are powerful because they update as new information comes in, helping you quickly spot big shifts in value or risk. For example, the most optimistic Northrop Grumman Narrative factors in robust international sales and production ramp-ups, resulting in a fair value estimate as high as $690 per share. In contrast, a cautious Narrative focused on program risks and funding uncertainty yields a much more conservative valuation around $510. Narratives help you decide, with clarity and confidence, when the stock’s price matches your expectations or presents an opportunity.
Do you think there's more to the story for Northrop Grumman? Create your own Narrative to let the Community know!
This article by Simply Wall St is general in nature. We provide commentary based on historical data and analyst forecasts only using an unbiased methodology and our articles are not intended to be financial advice. It does not constitute a recommendation to buy or sell any stock, and does not take account of your objectives, or your financial situation. We aim to bring you long-term focused analysis driven by fundamental data. Note that our analysis may not factor in the latest price-sensitive company announcements or qualitative material. Simply Wall St has no position in any stocks mentioned.
Valuation is complex, but we're here to simplify it.
Discover if Northrop Grumman might be undervalued or overvalued with our detailed analysis, featuring fair value estimates, potential risks, dividends, insider trades, and its financial condition.
Access Free AnalysisHave feedback on this article? Concerned about the content? Get in touch with us directly. Alternatively, email editorial-team@simplywallst.com
About NYSE:NOC
Northrop Grumman
Operates as an aerospace and defense technology company in the United States, the Asia/Pacific, Europe, and internationally.
Solid track record established dividend payer.
Similar Companies
Market Insights

Advertisement
Community Narratives
The company that turned a verb into a global necessity and basically runs the modern internet, digital ads, smartphones, maps, and AI.
Fair Value US$300.00|10.2% undervalued
OS
Community Contributor
Flowers Foods Pays A Fair Price For Health
Fair Value US$16.12|20.3% undervalued
NV
Community Contributor
TMX Group will thrive with 33.3% profit margin and enduring market moat
Fair Value CA$49.90|0.1% undervalued
LI
Community Contributor