
Advertisement
- United States
- /
- Machinery
- /
- NYSE:JBTM
Here's Why John Bean Technologies (NYSE:JBT) Can Manage Its Debt Responsibly
Some say volatility, rather than debt, is the best way to think about risk as an investor, but Warren Buffett famously said that 'Volatility is far from synonymous with risk.' So it might be obvious that you need to consider debt, when you think about how risky any given stock is, because too much debt can sink a company. We note that John Bean Technologies Corporation (NYSE:JBT) does have debt on its balance sheet. But is this debt a concern to shareholders?
When Is Debt Dangerous?
Debt assists a business until the business has trouble paying it off, either with new capital or with free cash flow. In the worst case scenario, a company can go bankrupt if it cannot pay its creditors. However, a more common (but still painful) scenario is that it has to raise new equity capital at a low price, thus permanently diluting shareholders. Of course, debt can be an important tool in businesses, particularly capital heavy businesses. The first thing to do when considering how much debt a business uses is to look at its cash and debt together.
View our latest analysis for John Bean Technologies
What Is John Bean Technologies's Debt?
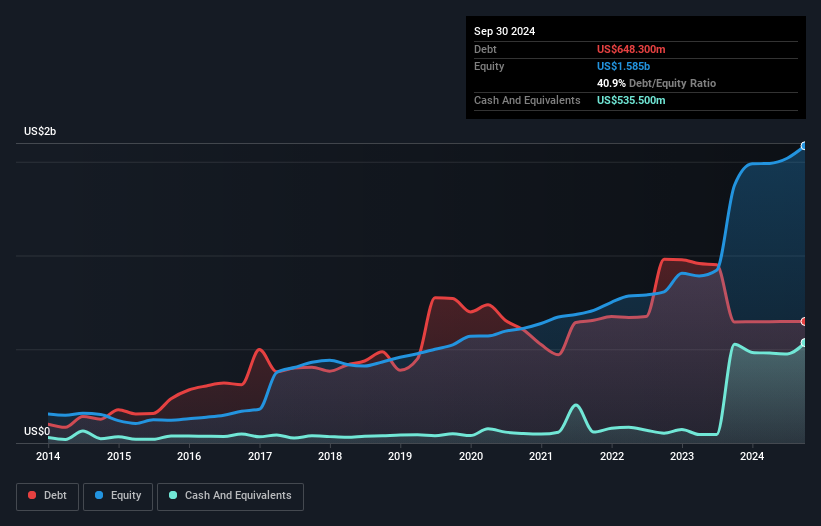
The chart below, which you can click on for greater detail, shows that John Bean Technologies had US$648.3m in debt in September 2024; about the same as the year before. However, it does have US$535.5m in cash offsetting this, leading to net debt of about US$112.8m.
How Strong Is John Bean Technologies' Balance Sheet?
According to the last reported balance sheet, John Bean Technologies had liabilities of US$473.4m due within 12 months, and liabilities of US$730.5m due beyond 12 months. Offsetting this, it had US$535.5m in cash and US$334.6m in receivables that were due within 12 months. So its liabilities total US$333.8m more than the combination of its cash and short-term receivables.
Of course, John Bean Technologies has a market capitalization of US$3.89b, so these liabilities are probably manageable. However, we do think it is worth keeping an eye on its balance sheet strength, as it may change over time.
We use two main ratios to inform us about debt levels relative to earnings. The first is net debt divided by earnings before interest, tax, depreciation, and amortization (EBITDA), while the second is how many times its earnings before interest and tax (EBIT) covers its interest expense (or its interest cover, for short). Thus we consider debt relative to earnings both with and without depreciation and amortization expenses.
John Bean Technologies has net debt of just 0.42 times EBITDA, suggesting it could ramp leverage without breaking a sweat. And remarkably, despite having net debt, it actually received more in interest over the last twelve months than it had to pay. So it's fair to say it can handle debt like a hotshot teppanyaki chef handles cooking. The good news is that John Bean Technologies has increased its EBIT by 6.2% over twelve months, which should ease any concerns about debt repayment. When analysing debt levels, the balance sheet is the obvious place to start. But it is future earnings, more than anything, that will determine John Bean Technologies's ability to maintain a healthy balance sheet going forward. So if you want to see what the professionals think, you might find this free report on analyst profit forecasts to be interesting.
Finally, a business needs free cash flow to pay off debt; accounting profits just don't cut it. So it's worth checking how much of that EBIT is backed by free cash flow. In the last three years, John Bean Technologies's free cash flow amounted to 31% of its EBIT, less than we'd expect. That weak cash conversion makes it more difficult to handle indebtedness.
Our View
Happily, John Bean Technologies's impressive interest cover implies it has the upper hand on its debt. But truth be told we feel its conversion of EBIT to free cash flow does undermine this impression a bit. All these things considered, it appears that John Bean Technologies can comfortably handle its current debt levels. On the plus side, this leverage can boost shareholder returns, but the potential downside is more risk of loss, so it's worth monitoring the balance sheet. Over time, share prices tend to follow earnings per share, so if you're interested in John Bean Technologies, you may well want to click here to check an interactive graph of its earnings per share history.
At the end of the day, it's often better to focus on companies that are free from net debt. You can access our special list of such companies (all with a track record of profit growth). It's free.
New: Manage All Your Stock Portfolios in One Place
We've created the ultimate portfolio companion for stock investors, and it's free.
• Connect an unlimited number of Portfolios and see your total in one currency
• Be alerted to new Warning Signs or Risks via email or mobile
• Track the Fair Value of your stocks
Have feedback on this article? Concerned about the content? Get in touch with us directly. Alternatively, email editorial-team (at) simplywallst.com.
This article by Simply Wall St is general in nature. We provide commentary based on historical data and analyst forecasts only using an unbiased methodology and our articles are not intended to be financial advice. It does not constitute a recommendation to buy or sell any stock, and does not take account of your objectives, or your financial situation. We aim to bring you long-term focused analysis driven by fundamental data. Note that our analysis may not factor in the latest price-sensitive company announcements or qualitative material. Simply Wall St has no position in any stocks mentioned.
About NYSE:JBTM
JBT Marel
Provides technology solutions to food and beverage industry in North America, Europe, the Middle East, Africa, the Asia Pacific, and Central and South America.
Good value with moderate growth potential.
Similar Companies
Market Insights

Advertisement
Weekly Picks
RO


RockeTeller on Santacruz Silver Mining ·
Crazy Undervalued 42 Baggers Silver Play (Active & Running Mine)
Fair Value:CA$8696.7% undervalued
50 followersusers have followed this narrative
6 commentsusers have commented on this narrative
16 likesusers have liked this narrative
RO


Robbo on Fiducian Group ·
Fiducian: Compliance Clouds or Value Opportunity?
Fair Value:AU$122.0% undervalued
7 followersusers have followed this narrative
0 commentsusers have commented on this narrative
0 likesusers have liked this narrative
WO

woodworthfund on Willamette Valley Vineyards ·
Willamette Valley Vineyards (WVVI): Not-So-Great Value
Fair Value:US$242.5% overvalued
10 followersusers have followed this narrative
0 commentsusers have commented on this narrative
1 likeusers have liked this narrative
Recently Updated Narratives
MO


mo7md on ADNOC Gas ·
ADNOC Gas future shines with a 21.4% revenue surge
Fair Value:د.إ3.728.9% undervalued
1 followerusers have followed this narrative
0 commentsusers have commented on this narrative
0 likesusers have liked this narrative
IN

IncomeAssets on Pulse Seismic ·
Watch Pulse Seismic Outperform with 13.6% Revenue Growth in the Coming Years
Fair Value:CA$4.4727.3% undervalued
3 followersusers have followed this narrative
0 commentsusers have commented on this narrative
0 likesusers have liked this narrative
VL

Vladislav on Galleon Gold ·
Significantly undervalued gold explorer in Timmins, finally getting traction
Fair Value:CA$481.5% undervalued
7 followersusers have followed this narrative
0 commentsusers have commented on this narrative
0 likesusers have liked this narrative
Popular Narratives
TH


TheWallstreetKing on MicroVision ·
MicroVision will explode future revenue by 380.37% with a vision towards success
Fair Value:US$6098.5% undervalued
116 followersusers have followed this narrative
11 commentsusers have commented on this narrative
22 likesusers have liked this narrative
AN


AnalystConsensusTarget on NVIDIA ·
NVDA: Expanding AI Demand Will Drive Major Data Center Investments Through 2026
Fair Value:US$250.3927.2% undervalued
957 followersusers have followed this narrative
6 commentsusers have commented on this narrative
25 likesusers have liked this narrative
RO
RockeTeller on Santacruz Silver Mining ·
Crazy Undervalued 42 Baggers Silver Play (Active & Running Mine)
Fair Value:CA$8696.7% undervalued
50 followersusers have followed this narrative
6 commentsusers have commented on this narrative
16 likesusers have liked this narrative

