
Advertisement
- United States
- /
- Machinery
- /
- NYSE:HLIO
An Intrinsic Calculation For Helios Technologies, Inc. (NYSE:HLIO) Suggests It's 48% Undervalued
Key Insights
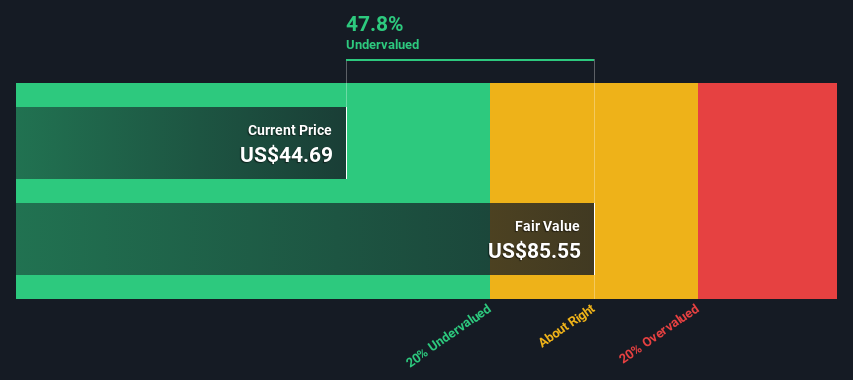
- Helios Technologies' estimated fair value is US$85.55 based on 2 Stage Free Cash Flow to Equity
- Helios Technologies' US$44.69 share price signals that it might be 48% undervalued
- The US$59.40 analyst price target for HLIO is 31% less than our estimate of fair value
Today we'll do a simple run through of a valuation method used to estimate the attractiveness of Helios Technologies, Inc. (NYSE:HLIO) as an investment opportunity by taking the forecast future cash flows of the company and discounting them back to today's value. We will take advantage of the Discounted Cash Flow (DCF) model for this purpose. Don't get put off by the jargon, the math behind it is actually quite straightforward.
We generally believe that a company's value is the present value of all of the cash it will generate in the future. However, a DCF is just one valuation metric among many, and it is not without flaws. Anyone interested in learning a bit more about intrinsic value should have a read of the Simply Wall St analysis model.
Check out our latest analysis for Helios Technologies
The Calculation
We use what is known as a 2-stage model, which simply means we have two different periods of growth rates for the company's cash flows. Generally the first stage is higher growth, and the second stage is a lower growth phase. To start off with, we need to estimate the next ten years of cash flows. Where possible we use analyst estimates, but when these aren't available we extrapolate the previous free cash flow (FCF) from the last estimate or reported value. We assume companies with shrinking free cash flow will slow their rate of shrinkage, and that companies with growing free cash flow will see their growth rate slow, over this period. We do this to reflect that growth tends to slow more in the early years than it does in later years.
A DCF is all about the idea that a dollar in the future is less valuable than a dollar today, so we need to discount the sum of these future cash flows to arrive at a present value estimate:
10-year free cash flow (FCF) estimate
| 2024 | 2025 | 2026 | 2027 | 2028 | 2029 | 2030 | 2031 | 2032 | 2033 | |
| Levered FCF ($, Millions) | US$78.8m | US$103.2m | US$137.6m | US$155.6m | US$169.0m | US$180.3m | US$190.0m | US$198.5m | US$206.0m | US$212.9m |
| Growth Rate Estimate Source | Analyst x4 | Analyst x4 | Analyst x1 | Analyst x1 | Est @ 8.60% | Est @ 6.71% | Est @ 5.38% | Est @ 4.45% | Est @ 3.80% | Est @ 3.35% |
| Present Value ($, Millions) Discounted @ 7.9% | US$73.0 | US$88.5 | US$109 | US$115 | US$115 | US$114 | US$111 | US$108 | US$104 | US$99.2 |
("Est" = FCF growth rate estimated by Simply Wall St)
Present Value of 10-year Cash Flow (PVCF) = US$1.0b
We now need to calculate the Terminal Value, which accounts for all the future cash flows after this ten year period. The Gordon Growth formula is used to calculate Terminal Value at a future annual growth rate equal to the 5-year average of the 10-year government bond yield of 2.3%. We discount the terminal cash flows to today's value at a cost of equity of 7.9%.
Terminal Value (TV)= FCF2033 × (1 + g) ÷ (r – g) = US$213m× (1 + 2.3%) ÷ (7.9%– 2.3%) = US$3.9b
Present Value of Terminal Value (PVTV)= TV / (1 + r)10= US$3.9b÷ ( 1 + 7.9%)10= US$1.8b
The total value, or equity value, is then the sum of the present value of the future cash flows, which in this case is US$2.8b. The last step is to then divide the equity value by the number of shares outstanding. Compared to the current share price of US$44.7, the company appears quite undervalued at a 48% discount to where the stock price trades currently. Remember though, that this is just an approximate valuation, and like any complex formula - garbage in, garbage out.
Important Assumptions
The calculation above is very dependent on two assumptions. The first is the discount rate and the other is the cash flows. Part of investing is coming up with your own evaluation of a company's future performance, so try the calculation yourself and check your own assumptions. The DCF also does not consider the possible cyclicality of an industry, or a company's future capital requirements, so it does not give a full picture of a company's potential performance. Given that we are looking at Helios Technologies as potential shareholders, the cost of equity is used as the discount rate, rather than the cost of capital (or weighted average cost of capital, WACC) which accounts for debt. In this calculation we've used 7.9%, which is based on a levered beta of 1.228. Beta is a measure of a stock's volatility, compared to the market as a whole. We get our beta from the industry average beta of globally comparable companies, with an imposed limit between 0.8 and 2.0, which is a reasonable range for a stable business.
SWOT Analysis for Helios Technologies
Strength
- Debt is well covered by earnings.
- Dividends are covered by earnings and cash flows.
Weakness
- Earnings declined over the past year.
- Dividend is low compared to the top 25% of dividend payers in the Machinery market.
Opportunity
- Annual earnings are forecast to grow faster than the American market.
- Trading below our estimate of fair value by more than 20%.
Threat
- Debt is not well covered by operating cash flow.
- Annual revenue is forecast to grow slower than the American market.
Moving On:
Although the valuation of a company is important, it shouldn't be the only metric you look at when researching a company. DCF models are not the be-all and end-all of investment valuation. Rather it should be seen as a guide to "what assumptions need to be true for this stock to be under/overvalued?" For example, changes in the company's cost of equity or the risk free rate can significantly impact the valuation. Why is the intrinsic value higher than the current share price? For Helios Technologies, we've put together three further items you should consider:
- Risks: As an example, we've found 2 warning signs for Helios Technologies (1 shouldn't be ignored!) that you need to consider before investing here.
- Future Earnings: How does HLIO's growth rate compare to its peers and the wider market? Dig deeper into the analyst consensus number for the upcoming years by interacting with our free analyst growth expectation chart.
- Other High Quality Alternatives: Do you like a good all-rounder? Explore our interactive list of high quality stocks to get an idea of what else is out there you may be missing!
PS. The Simply Wall St app conducts a discounted cash flow valuation for every stock on the NYSE every day. If you want to find the calculation for other stocks just search here.
Valuation is complex, but we're here to simplify it.
Discover if Helios Technologies might be undervalued or overvalued with our detailed analysis, featuring fair value estimates, potential risks, dividends, insider trades, and its financial condition.
Access Free AnalysisHave feedback on this article? Concerned about the content? Get in touch with us directly. Alternatively, email editorial-team (at) simplywallst.com.
This article by Simply Wall St is general in nature. We provide commentary based on historical data and analyst forecasts only using an unbiased methodology and our articles are not intended to be financial advice. It does not constitute a recommendation to buy or sell any stock, and does not take account of your objectives, or your financial situation. We aim to bring you long-term focused analysis driven by fundamental data. Note that our analysis may not factor in the latest price-sensitive company announcements or qualitative material. Simply Wall St has no position in any stocks mentioned.
About NYSE:HLIO
Helios Technologies
Provides engineered motion control and electronic controls technology solutions in the Americas, Europe, the Middle East, Africa, and the Asia Pacific.
Proven track record with moderate growth potential.
Similar Companies
Market Insights

Advertisement
Community Narratives
The Next Phase of Energy Storage: How NeoVolta Is Tackling America’s Power Crunch
Fair Value US$7.50|35.1% undervalued
MA
Community Contributor
Why EnSilica is Worth Possibly 13x its Current Price
Fair Value UK£5.00|89.8% undervalued
DO
Community Contributor
M&A Activity, Industry Diversification & A Defense Contract Monopoly Will Push BWXT For Healthy Long-Term Growth
Fair Value US$220.00|15.2% undervalued
CL
Community Contributor
A case for Cassiar Gold Corp (TSXV: GLDC) to reach CAD$8-10 before 2030 (X30-37)
Fair Value CA$10.00|96.0% undervalued
AG
Community Contributor