
Advertisement
- United States
- /
- Trade Distributors
- /
- NYSE:GWW
Should You Be Tempted To Sell W.W. Grainger, Inc. (NYSE:GWW) Because Of Its P/E Ratio?
Want to participate in a short research study? Help shape the future of investing tools and you could win a $250 gift card!
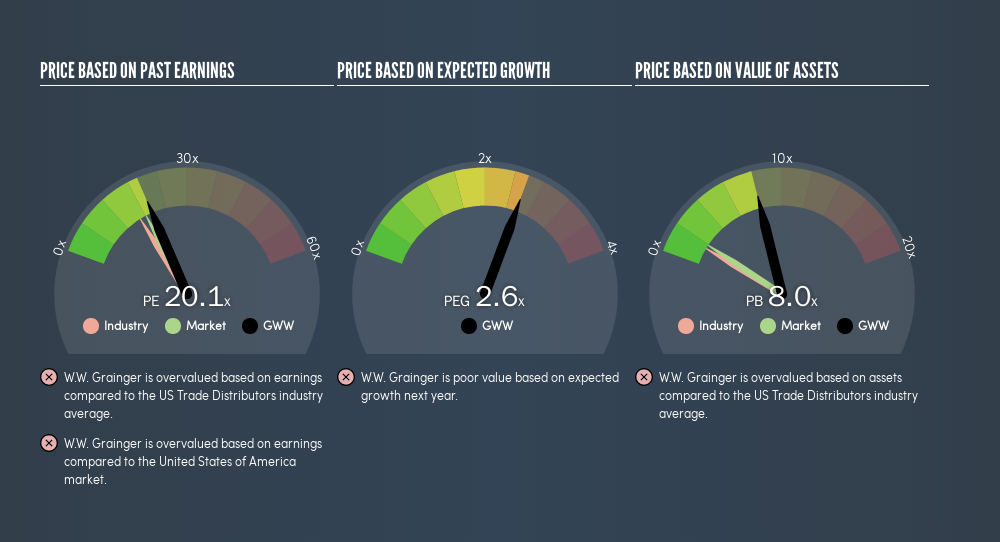
The goal of this article is to teach you how to use price to earnings ratios (P/E ratios). To keep it practical, we'll show how W.W. Grainger, Inc.'s (NYSE:GWW) P/E ratio could help you assess the value on offer. W.W. Grainger has a P/E ratio of 20.05, based on the last twelve months. In other words, at today's prices, investors are paying $20.05 for every $1 in prior year profit.
View our latest analysis for W.W. Grainger
How Do I Calculate W.W. Grainger's Price To Earnings Ratio?
The formula for price to earnings is:
Price to Earnings Ratio = Price per Share ÷ Earnings per Share (EPS)
Or for W.W. Grainger:
P/E of 20.05 = $284.85 ÷ $14.2 (Based on the year to March 2019.)
Is A High P/E Ratio Good?
A higher P/E ratio means that buyers have to pay a higher price for each $1 the company has earned over the last year. All else being equal, it's better to pay a low price -- but as Warren Buffett said, 'It's far better to buy a wonderful company at a fair price than a fair company at a wonderful price.'
How Growth Rates Impact P/E Ratios
Probably the most important factor in determining what P/E a company trades on is the earnings growth. That's because companies that grow earnings per share quickly will rapidly increase the 'E' in the equation. Therefore, even if you pay a high multiple of earnings now, that multiple will become lower in the future. A lower P/E should indicate the stock is cheap relative to others -- and that may attract buyers.
W.W. Grainger increased earnings per share by a whopping 27% last year. And earnings per share have improved by 4.5% annually, over the last five years. I'd therefore be a little surprised if its P/E ratio was not relatively high.
Does W.W. Grainger Have A Relatively High Or Low P/E For Its Industry?
One good way to get a quick read on what market participants expect of a company is to look at its P/E ratio. As you can see below, W.W. Grainger has a higher P/E than the average company (16.4) in the trade distributors industry.
W.W. Grainger's P/E tells us that market participants think the company will perform better than its industry peers, going forward. Clearly the market expects growth, but it isn't guaranteed. So further research is always essential. I often monitor director buying and selling.
Don't Forget: The P/E Does Not Account For Debt or Bank Deposits
It's important to note that the P/E ratio considers the market capitalization, not the enterprise value. In other words, it does not consider any debt or cash that the company may have on the balance sheet. The exact same company would hypothetically deserve a higher P/E ratio if it had a strong balance sheet, than if it had a weak one with lots of debt, because a cashed up company can spend on growth.
Such expenditure might be good or bad, in the long term, but the point here is that the balance sheet is not reflected by this ratio.
W.W. Grainger's Balance Sheet
W.W. Grainger's net debt is 13% of its market cap. This could bring some additional risk, and reduce the number of investment options for management; worth remembering if you compare its P/E to businesses without debt.
The Verdict On W.W. Grainger's P/E Ratio
W.W. Grainger's P/E is 20.1 which is above average (18.3) in the US market. The company is not overly constrained by its modest debt levels, and its recent EPS growth very solid. Therefore, it's not particularly surprising that it has a above average P/E ratio.
Investors should be looking to buy stocks that the market is wrong about. If the reality for a company is better than it expects, you can make money by buying and holding for the long term. So this freereport on the analyst consensus forecasts could help you make a master move on this stock.
But note: W.W. Grainger may not be the best stock to buy. So take a peek at this freelist of interesting companies with strong recent earnings growth (and a P/E ratio below 20).
We aim to bring you long-term focused research analysis driven by fundamental data. Note that our analysis may not factor in the latest price-sensitive company announcements or qualitative material.
If you spot an error that warrants correction, please contact the editor at editorial-team@simplywallst.com. This article by Simply Wall St is general in nature. It does not constitute a recommendation to buy or sell any stock, and does not take account of your objectives, or your financial situation. Simply Wall St has no position in the stocks mentioned. Thank you for reading.
About NYSE:GWW
W.W. Grainger
Distributes maintenance, repair, and operating products and services primarily in North America, Japan, and the United Kingdom.
Excellent balance sheet average dividend payer.
Similar Companies
Market Insights

Advertisement
Weekly Picks
RO


RockeTeller on Santacruz Silver Mining ·
Crazy Undervalued 42 Baggers Silver Play (Active & Running Mine)
Fair Value:CA$8696.4% undervalued
40 followersusers have followed this narrative
6 commentsusers have commented on this narrative
11 likesusers have liked this narrative
RO


Robbo on Fiducian Group ·
Fiducian: Compliance Clouds or Value Opportunity?
Fair Value:AU$123.8% undervalued
4 followersusers have followed this narrative
0 commentsusers have commented on this narrative
0 likesusers have liked this narrative
WO

woodworthfund on Willamette Valley Vineyards ·
Willamette Valley Vineyards (WVVI): Not-So-Great Value
Fair Value:US$244.5% overvalued
6 followersusers have followed this narrative
0 commentsusers have commented on this narrative
1 likeusers have liked this narrative
Recently Updated Narratives
VL

Vladislav on Galleon Gold ·
Significantly undervalued gold explorer in Timmins, finally getting traction
Fair Value:CA$482.9% undervalued
1 followerusers have followed this narrative
0 commentsusers have commented on this narrative
0 likesusers have liked this narrative
FU

FundamentallySarcastic on Credit Corp Group ·
Moderation and Stabilisation: HOLD: Fair Price based on a 4-year Cycle is $12.08
Fair Value:AU$12.6411.8% overvalued
3 followersusers have followed this narrative
0 commentsusers have commented on this narrative
0 likesusers have liked this narrative
MA


MarkoVT on Alphabet ·
Positioned globally, partnered locally
Fair Value:US$390.1918.1% undervalued
6 followersusers have followed this narrative
0 commentsusers have commented on this narrative
0 likesusers have liked this narrative
Popular Narratives
TH


TheWallstreetKing on MicroVision ·
MicroVision will explode future revenue by 380.37% with a vision towards success
Fair Value:US$6098.5% undervalued
115 followersusers have followed this narrative
11 commentsusers have commented on this narrative
22 likesusers have liked this narrative
AN


AnalystConsensusTarget on NVIDIA ·
NVDA: Expanding AI Demand Will Drive Major Data Center Investments Through 2026
Fair Value:US$250.3928.3% undervalued
952 followersusers have followed this narrative
6 commentsusers have commented on this narrative
25 likesusers have liked this narrative
OS

oscargarcia on Alphabet ·
The company that turned a verb into a global necessity and basically runs the modern internet, digital ads, smartphones, maps, and AI.
Fair Value:US$3406.0% undervalued
147 followersusers have followed this narrative
6 commentsusers have commented on this narrative
18 likesusers have liked this narrative

