- United States
- /
- Machinery
- /
- NYSE:GTLS
Positive Sentiment Still Eludes Chart Industries, Inc. (NYSE:GTLS) Following 30% Share Price Slump
Unfortunately for some shareholders, the Chart Industries, Inc. (NYSE:GTLS) share price has dived 30% in the last thirty days, prolonging recent pain. Instead of being rewarded, shareholders who have already held through the last twelve months are now sitting on a 26% share price drop.
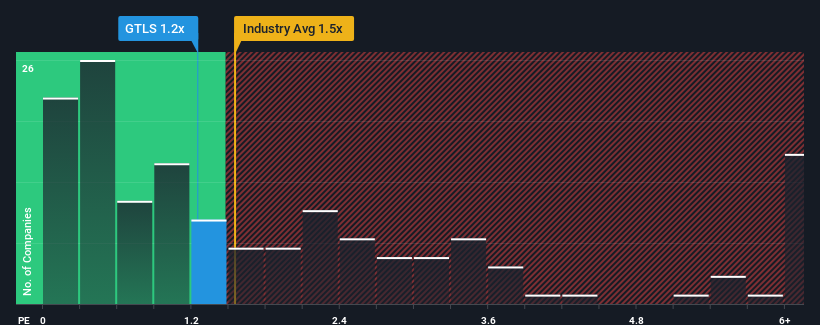
Although its price has dipped substantially, there still wouldn't be many who think Chart Industries' price-to-sales (or "P/S") ratio of 1.2x is worth a mention when the median P/S in the United States' Machinery industry is similar at about 1.5x. However, investors might be overlooking a clear opportunity or potential setback if there is no rational basis for the P/S.
View our latest analysis for Chart Industries

What Does Chart Industries' P/S Mean For Shareholders?
Chart Industries certainly has been doing a good job lately as its revenue growth has been positive while most other companies have been seeing their revenue go backwards. Perhaps the market is expecting its current strong performance to taper off in accordance to the rest of the industry, which has kept the P/S contained. If not, then existing shareholders have reason to be feeling optimistic about the future direction of the share price.
Want the full picture on analyst estimates for the company? Then our free report on Chart Industries will help you uncover what's on the horizon.How Is Chart Industries' Revenue Growth Trending?
The only time you'd be comfortable seeing a P/S like Chart Industries' is when the company's growth is tracking the industry closely.
Retrospectively, the last year delivered an exceptional 24% gain to the company's top line. The strong recent performance means it was also able to grow revenue by 216% in total over the last three years. Therefore, it's fair to say the revenue growth recently has been superb for the company.
Looking ahead now, revenue is anticipated to climb by 9.1% per year during the coming three years according to the analysts following the company. With the industry only predicted to deliver 3.6% each year, the company is positioned for a stronger revenue result.
In light of this, it's curious that Chart Industries' P/S sits in line with the majority of other companies. It may be that most investors aren't convinced the company can achieve future growth expectations.
What We Can Learn From Chart Industries' P/S?
With its share price dropping off a cliff, the P/S for Chart Industries looks to be in line with the rest of the Machinery industry. Using the price-to-sales ratio alone to determine if you should sell your stock isn't sensible, however it can be a practical guide to the company's future prospects.
Looking at Chart Industries' analyst forecasts revealed that its superior revenue outlook isn't giving the boost to its P/S that we would've expected. When we see a strong revenue outlook, with growth outpacing the industry, we can only assume potential uncertainty around these figures are what might be placing slight pressure on the P/S ratio. This uncertainty seems to be reflected in the share price which, while stable, could be higher given the revenue forecasts.
It's always necessary to consider the ever-present spectre of investment risk. We've identified 1 warning sign with Chart Industries , and understanding should be part of your investment process.
It's important to make sure you look for a great company, not just the first idea you come across. So if growing profitability aligns with your idea of a great company, take a peek at this free list of interesting companies with strong recent earnings growth (and a low P/E).
New: AI Stock Screener & Alerts
Our new AI Stock Screener scans the market every day to uncover opportunities.
• Dividend Powerhouses (3%+ Yield)
• Undervalued Small Caps with Insider Buying
• High growth Tech and AI Companies
Or build your own from over 50 metrics.
Have feedback on this article? Concerned about the content? Get in touch with us directly. Alternatively, email editorial-team (at) simplywallst.com.
This article by Simply Wall St is general in nature. We provide commentary based on historical data and analyst forecasts only using an unbiased methodology and our articles are not intended to be financial advice. It does not constitute a recommendation to buy or sell any stock, and does not take account of your objectives, or your financial situation. We aim to bring you long-term focused analysis driven by fundamental data. Note that our analysis may not factor in the latest price-sensitive company announcements or qualitative material. Simply Wall St has no position in any stocks mentioned.
About NYSE:GTLS
Chart Industries
Engages in the designing, engineering, and manufacturing of process technologies and equipment for the gas and liquid molecules in the United States and internationally.
Fair value with moderate growth potential.
Similar Companies
Market Insights
Community Narratives


Recently Updated Narratives


No miracle in sight


Q3 Outlook modestly optimistic


Alphabet: The Under-appreciated Compounder Hiding in Plain Sight
Popular Narratives


The company that turned a verb into a global necessity and basically runs the modern internet, digital ads, smartphones, maps, and AI.


MicroVision will explode future revenue by 380.37% with a vision towards success


