
Advertisement
- United States
- /
- Machinery
- /
- NYSE:GTLS
Even With A 27% Surge, Cautious Investors Are Not Rewarding Chart Industries, Inc.'s (NYSE:GTLS) Performance Completely
Chart Industries, Inc. (NYSE:GTLS) shareholders would be excited to see that the share price has had a great month, posting a 27% gain and recovering from prior weakness. The last 30 days bring the annual gain to a very sharp 43%.
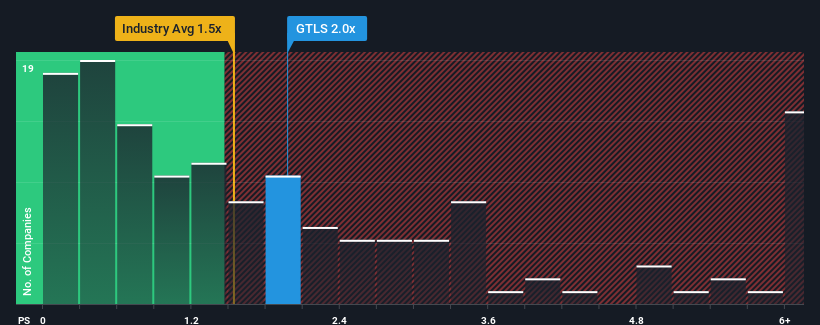
In spite of the firm bounce in price, it's still not a stretch to say that Chart Industries' price-to-sales (or "P/S") ratio of 2x right now seems quite "middle-of-the-road" compared to the Machinery industry in the United States, where the median P/S ratio is around 1.5x. However, investors might be overlooking a clear opportunity or potential setback if there is no rational basis for the P/S.
View our latest analysis for Chart Industries
How Has Chart Industries Performed Recently?
With revenue growth that's superior to most other companies of late, Chart Industries has been doing relatively well. One possibility is that the P/S ratio is moderate because investors think this strong revenue performance might be about to tail off. If you like the company, you'd be hoping this isn't the case so that you could potentially pick up some stock while it's not quite in favour.
If you'd like to see what analysts are forecasting going forward, you should check out our free report on Chart Industries.Is There Some Revenue Growth Forecasted For Chart Industries?
The only time you'd be comfortable seeing a P/S like Chart Industries' is when the company's growth is tracking the industry closely.
Taking a look back first, we see that the company grew revenue by an impressive 108% last year. The latest three year period has also seen an excellent 185% overall rise in revenue, aided by its short-term performance. Therefore, it's fair to say the revenue growth recently has been superb for the company.
Turning to the outlook, the next three years should generate growth of 19% per annum as estimated by the analysts watching the company. That's shaping up to be materially higher than the 5.5% each year growth forecast for the broader industry.
With this information, we find it interesting that Chart Industries is trading at a fairly similar P/S compared to the industry. Apparently some shareholders are skeptical of the forecasts and have been accepting lower selling prices.
The Bottom Line On Chart Industries' P/S
Chart Industries' stock has a lot of momentum behind it lately, which has brought its P/S level with the rest of the industry. It's argued the price-to-sales ratio is an inferior measure of value within certain industries, but it can be a powerful business sentiment indicator.
Looking at Chart Industries' analyst forecasts revealed that its superior revenue outlook isn't giving the boost to its P/S that we would've expected. Perhaps uncertainty in the revenue forecasts are what's keeping the P/S ratio consistent with the rest of the industry. This uncertainty seems to be reflected in the share price which, while stable, could be higher given the revenue forecasts.
Plus, you should also learn about these 3 warning signs we've spotted with Chart Industries (including 1 which shouldn't be ignored).
If you're unsure about the strength of Chart Industries' business, why not explore our interactive list of stocks with solid business fundamentals for some other companies you may have missed.
New: AI Stock Screener & Alerts
Our new AI Stock Screener scans the market every day to uncover opportunities.
• Dividend Powerhouses (3%+ Yield)
• Undervalued Small Caps with Insider Buying
• High growth Tech and AI Companies
Or build your own from over 50 metrics.
Have feedback on this article? Concerned about the content? Get in touch with us directly. Alternatively, email editorial-team (at) simplywallst.com.
This article by Simply Wall St is general in nature. We provide commentary based on historical data and analyst forecasts only using an unbiased methodology and our articles are not intended to be financial advice. It does not constitute a recommendation to buy or sell any stock, and does not take account of your objectives, or your financial situation. We aim to bring you long-term focused analysis driven by fundamental data. Note that our analysis may not factor in the latest price-sensitive company announcements or qualitative material. Simply Wall St has no position in any stocks mentioned.
About NYSE:GTLS
Chart Industries
Engages in the designing, engineering, and manufacturing of process technologies and equipment for the gas and liquid molecules in the United States and internationally.
Solid track record and fair value.
Similar Companies
Market Insights

Advertisement
Community Narratives
Finding The True Value Of A Logistics Powerhouse
Fair Value US$95.21|8.6% undervalued
NV
Community Contributor
Paradigm Biopharmaceuticals Will Lead Osteoarthritis Treatment with Zilosul's FDA Success
Fair Value AU$5.50|92.1% undervalued
AM
Community Contributor
Barrick Mining (ABX:CA): A Gold Hedge against a U.S. Shutdown
Fair Value CA$60.00|25.6% undervalued
GM
Community Contributor