
Advertisement
- United States
- /
- Machinery
- /
- NYSE:GTLS
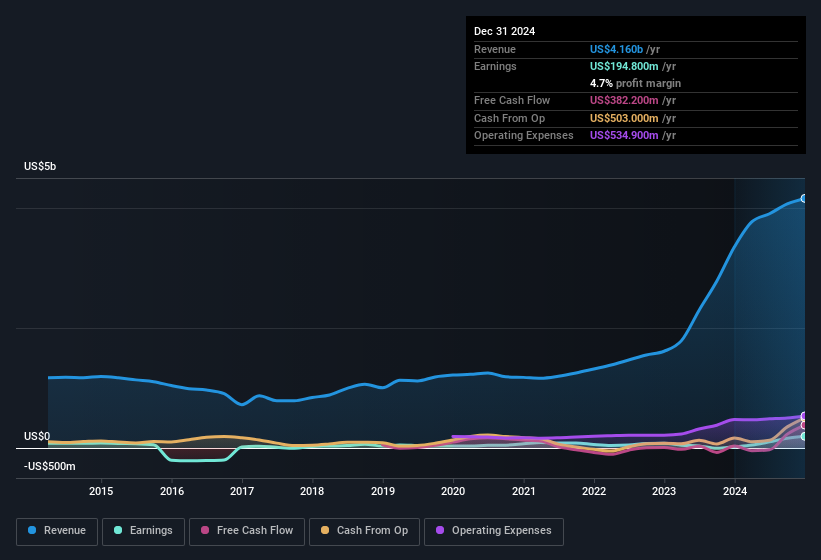
Chart Industries (NYSE:GTLS) Posted Healthy Earnings But There Are Some Other Factors To Be Aware Of
Investors were disappointed with Chart Industries, Inc.'s (NYSE:GTLS) earnings, despite the strong profit numbers. Our analysis uncovered some concerning factors that we believe the market might be paying attention to.
View our latest analysis for Chart Industries
To understand the value of a company's earnings growth, it is imperative to consider any dilution of shareholders' interests. Chart Industries expanded the number of shares on issue by 8.2% over the last year. That means its earnings are split among a greater number of shares. To celebrate net income while ignoring dilution is like rejoicing because you have a single slice of a larger pizza, but ignoring the fact that the pizza is now cut into many more slices. You can see a chart of Chart Industries' EPS by clicking here.
A Look At The Impact Of Chart Industries' Dilution On Its Earnings Per Share (EPS)
As you can see above, Chart Industries has been growing its net income over the last few years, with an annualized gain of 230% over three years. But EPS was only up 178% per year, in the exact same period. And the 846% profit boost in the last year certainly seems impressive at first glance. But in comparison, EPS only increased by 842% over the same period. Therefore, the dilution is having a noteworthy influence on shareholder returns.
Changes in the share price do tend to reflect changes in earnings per share, in the long run. So Chart Industries shareholders will want to see that EPS figure continue to increase. But on the other hand, we'd be far less excited to learn profit (but not EPS) was improving. For the ordinary retail shareholder, EPS is a great measure to check your hypothetical "share" of the company's profit.
That might leave you wondering what analysts are forecasting in terms of future profitability. Luckily, you can click here to see an interactive graph depicting future profitability, based on their estimates.
Our Take On Chart Industries' Profit Performance
Each Chart Industries share now gets a meaningfully smaller slice of its overall profit, due to dilution of existing shareholders. Therefore, it seems possible to us that Chart Industries' true underlying earnings power is actually less than its statutory profit. But on the bright side, its earnings per share have grown at an extremely impressive rate over the last three years. At the end of the day, it's essential to consider more than just the factors above, if you want to understand the company properly. So if you'd like to dive deeper into this stock, it's crucial to consider any risks it's facing. For example, we've discovered 1 warning sign that you should run your eye over to get a better picture of Chart Industries.
Today we've zoomed in on a single data point to better understand the nature of Chart Industries' profit. But there is always more to discover if you are capable of focussing your mind on minutiae. For example, many people consider a high return on equity as an indication of favorable business economics, while others like to 'follow the money' and search out stocks that insiders are buying. While it might take a little research on your behalf, you may find this free collection of companies boasting high return on equity, or this list of stocks with significant insider holdings to be useful.
New: AI Stock Screener & Alerts
Our new AI Stock Screener scans the market every day to uncover opportunities.
• Dividend Powerhouses (3%+ Yield)
• Undervalued Small Caps with Insider Buying
• High growth Tech and AI Companies
Or build your own from over 50 metrics.
Have feedback on this article? Concerned about the content? Get in touch with us directly. Alternatively, email editorial-team (at) simplywallst.com.
This article by Simply Wall St is general in nature. We provide commentary based on historical data and analyst forecasts only using an unbiased methodology and our articles are not intended to be financial advice. It does not constitute a recommendation to buy or sell any stock, and does not take account of your objectives, or your financial situation. We aim to bring you long-term focused analysis driven by fundamental data. Note that our analysis may not factor in the latest price-sensitive company announcements or qualitative material. Simply Wall St has no position in any stocks mentioned.
About NYSE:GTLS
Chart Industries
Engages in the designing, engineering, and manufacturing of process technologies and equipment for the gas and liquid molecules in the United States and internationally.
Fair value with moderate growth potential.
Similar Companies
Market Insights

Advertisement
Community Narratives
MicroVision will explode future revenue by 380.37% with a vision towards success
Fair Value US$60|98.4% undervalued
TH
Community Contributor
The Indispensable Artery for a New North American Economy
Fair Value CA$132.87|0.6% undervalued
TI
Community Contributor
Recently Updated Narratives
BL


BlackGoat on Alphabet ·
Alphabet: The Under-appreciated Compounder Hiding in Plain Sight
Fair Value:US$324.481.3% undervalued
75 followersusers have followed this narrative
3 commentsusers have commented on this narrative
1 likeusers have liked this narrative
BE


Bejgal on MINISO Group Holding ·
MINISO's fair value is projected at 26.69 with an anticipated PE ratio shift of 20x
Fair Value:US$26.6926.7% undervalued
44 followersusers have followed this narrative
3 commentsusers have commented on this narrative
0 likesusers have liked this narrative
TI


TickerTickle on Oracle ·
The Quiet Giant That Became AI’s Power Grid
Fair Value:US$389.8147.4% undervalued
9 followersusers have followed this narrative
2 commentsusers have commented on this narrative
0 likesusers have liked this narrative
Popular Narratives
OS

oscargarcia on Alphabet ·
The company that turned a verb into a global necessity and basically runs the modern internet, digital ads, smartphones, maps, and AI.
Fair Value:US$3405.9% undervalued
136 followersusers have followed this narrative
6 commentsusers have commented on this narrative
18 likesusers have liked this narrative
TH

TheWallstreetKing on MicroVision ·
MicroVision will explode future revenue by 380.37% with a vision towards success
Fair Value:US$6098.4% undervalued
89 followersusers have followed this narrative
11 commentsusers have commented on this narrative
18 likesusers have liked this narrative
AN


AnalystConsensusTarget on NVIDIA ·
NVDA: Expanding AI Demand Will Drive Major Data Center Investments Through 2026
Fair Value:US$232.7922.6% undervalued
926 followersusers have followed this narrative
6 commentsusers have commented on this narrative
22 likesusers have liked this narrative