Advertisement
- United States
- /
- Machinery
- /
- NYSE:GTLS
Chart Industries (GTLS) Margin Contraction and $271M Loss Challenge Bullish Growth Narratives

Simply Wall St
Reviewed by Simply Wall St
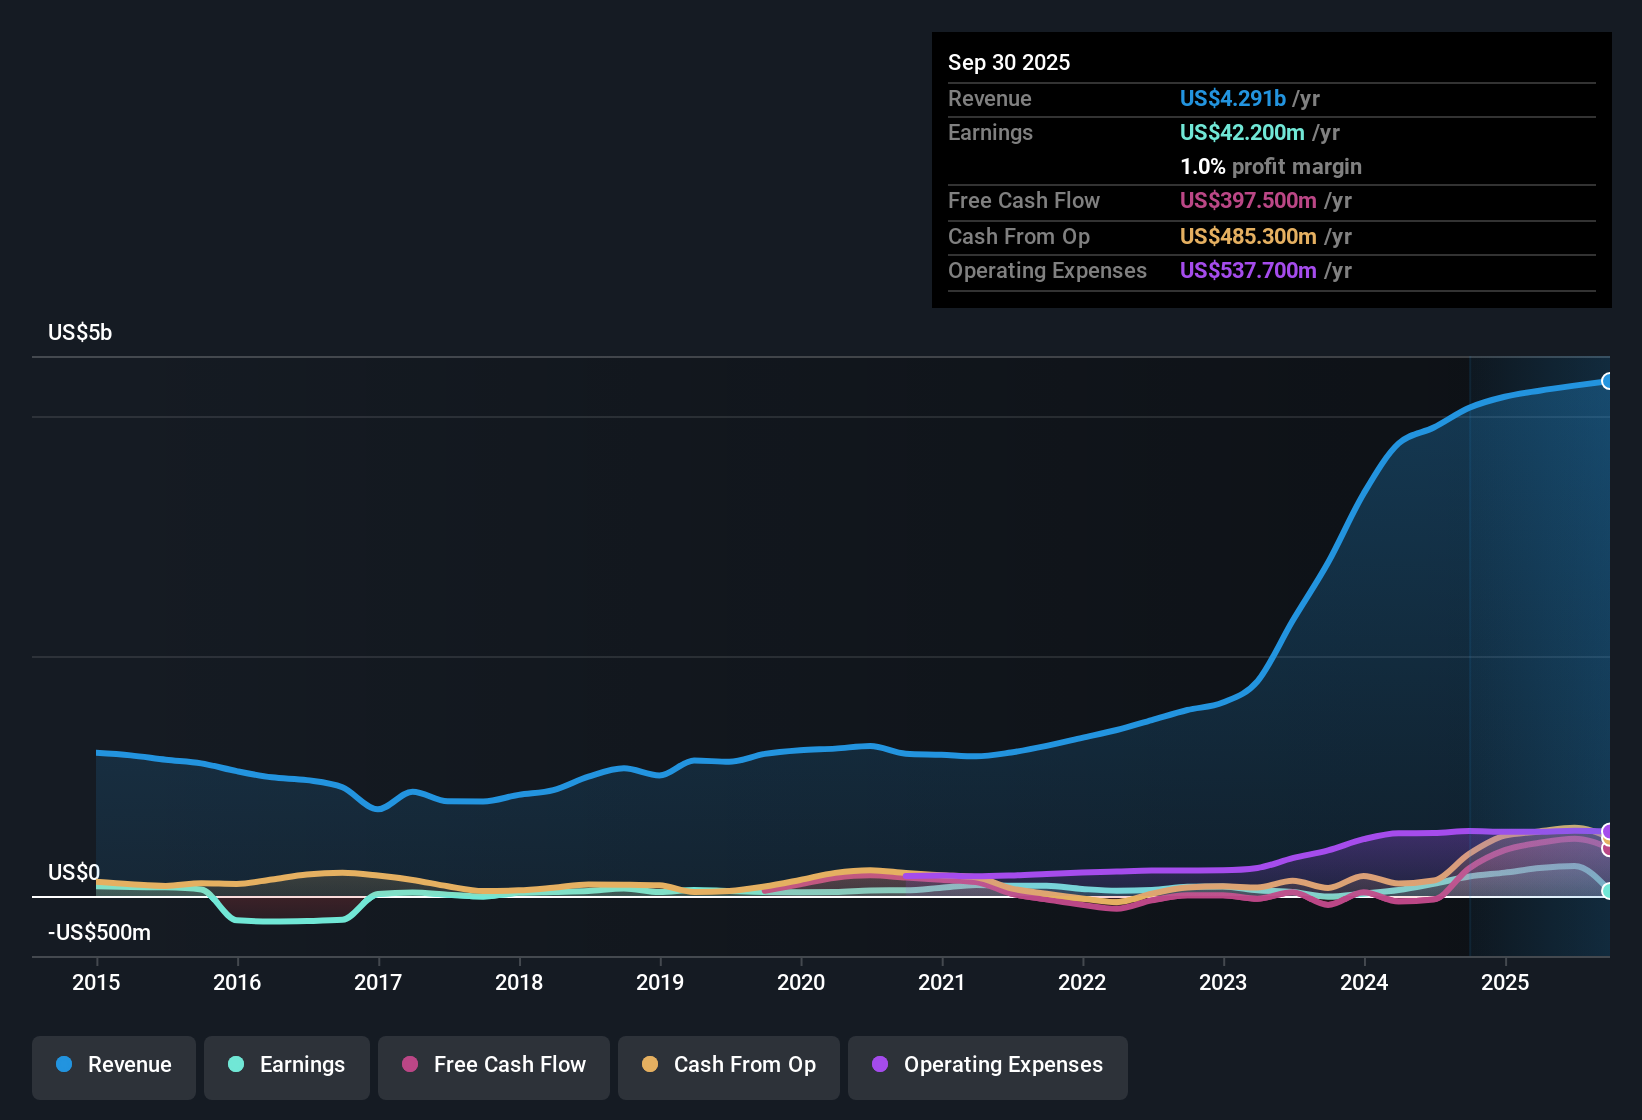
Chart Industries (GTLS) posted a current net profit margin of 1%, down from 4% the previous year. Results were affected by a one-off loss of $271.4 million, which impacted overall earnings quality. While revenue is expected to grow 8.1% per year, a bit slower than the US market, analysts are projecting a standout 47.1% annual growth in earnings, outpacing the broader market's 15.7% forecast. Investors will be weighing the strong earnings outlook and attractive valuation compared to peers against the clear headwinds seen in recent margins and exceptional losses.
See our full analysis for Chart Industries.Up next, we stack these headline numbers against the most popular narratives in the community to see which beliefs still hold, and which may need to be re-examined.
See what the community is saying about Chart Industries
Backlog Growth Fuels Optimism
- Chart Industries reported a 17.3% increase in order volume from Q1 2024 to Q1 2025, indicating new business that could support revenue growth as these orders turn into sales.
- Analysts' consensus view sees this backlog and new order momentum as a foundation for robust project pipelines and improved future earnings.
- Strategic positioning in high-demand sectors such as LNG, data centers, and space is expected to underpin expanding project opportunities.
- An increase in higher-margin aftermarket services, now about a third of revenue, is expected to help drive future margin improvement.
Consensus narrative highlights how rising orders and ambitious project pipelines may set up Chart Industries for growth as new revenue is realized in coming years. 📊 Read the full Chart Industries Consensus Narrative.
Margins Recovering on Cost Synergy
- Integration of Howden delivered 190 basis points of adjusted operating income margin expansion, directly softening the impact of earlier margin compression and one-off losses.
- Analysts' consensus view expects continued operating margin recovery through both cost synergies and the expansion of high-margin aftermarket services.
- Forecasts call for profit margins to rise from 5.9% today to 13.4% in three years as backlog projects are fulfilled and cost efficiencies take hold.
- This expectation balances optimism over margin recovery against the real risks of project delays or market downturns.
Valuation Sits Below DCF Fair Value
- With the share price at $199.35, Chart Industries trades at a discount to its DCF fair value of $252.88 but only a modest premium to the analyst price target of $206.27.
- Analysts' consensus view maintains that while the upside to DCF is notable, the limited gap to the target price points to fair pricing at current levels.
- Shares are considered good value compared to peers on price-to-sales but still carry a premium to the broader US machinery industry.
- This tension between modeled value, analyst expectations, and peer pricing keeps the valuation debate active for investors.
Next Steps
To see how these results tie into long-term growth, risks, and valuation, check out the full range of community narratives for Chart Industries on Simply Wall St. Add the company to your watchlist or portfolio so you'll be alerted when the story evolves.
Spot an opportunity or risk others might have missed? In just a few minutes, you can share your perspective and shape your own narrative. Do it your way
A great starting point for your Chart Industries research is our analysis highlighting 2 key rewards and 3 important warning signs that could impact your investment decision.
See What Else Is Out There
Chart Industries' recent results were affected by one-off losses, margin volatility, and revenue growth that lags behind the broader market pace.
If you want companies with steadier performance and more predictable expansion, focus on those showing consistent results with stable growth stocks screener (2113 results) right now.
This article by Simply Wall St is general in nature. We provide commentary based on historical data and analyst forecasts only using an unbiased methodology and our articles are not intended to be financial advice. It does not constitute a recommendation to buy or sell any stock, and does not take account of your objectives, or your financial situation. We aim to bring you long-term focused analysis driven by fundamental data. Note that our analysis may not factor in the latest price-sensitive company announcements or qualitative material. Simply Wall St has no position in any stocks mentioned.
New: AI Stock Screener & Alerts
Our new AI Stock Screener scans the market every day to uncover opportunities.
• Dividend Powerhouses (3%+ Yield)
• Undervalued Small Caps with Insider Buying
• High growth Tech and AI Companies
Or build your own from over 50 metrics.
Have feedback on this article? Concerned about the content? Get in touch with us directly. Alternatively, email editorial-team@simplywallst.com
About NYSE:GTLS
Chart Industries
Engages in the designing, engineering, and manufacturing of process technologies and equipment for the gas and liquid molecules in the United States and internationally.
Good value with moderate growth potential.
Similar Companies
Market Insights

Advertisement
Community Narratives
The company that turned a verb into a global necessity and basically runs the modern internet, digital ads, smartphones, maps, and AI.
Fair Value US$300.00|6.2% undervalued
OS
Community Contributor
Flowers Foods Pays A Fair Price For Health
Fair Value US$16.12|25.1% undervalued
NV
Community Contributor
TMX Group will thrive with 33.3% profit margin and enduring market moat
Fair Value CA$49.90|0.04% overvalued
LI
Community Contributor