- United States
- /
- Machinery
- /
- NYSE:ESE
These 4 Measures Indicate That ESCO Technologies (NYSE:ESE) Is Using Debt Safely


Legendary fund manager Li Lu (who Charlie Munger backed) once said, 'The biggest investment risk is not the volatility of prices, but whether you will suffer a permanent loss of capital.' So it seems the smart money knows that debt - which is usually involved in bankruptcies - is a very important factor, when you assess how risky a company is. As with many other companies ESCO Technologies Inc. (NYSE:ESE) makes use of debt. But the real question is whether this debt is making the company risky.
Why Does Debt Bring Risk?
Debt and other liabilities become risky for a business when it cannot easily fulfill those obligations, either with free cash flow or by raising capital at an attractive price. In the worst case scenario, a company can go bankrupt if it cannot pay its creditors. While that is not too common, we often do see indebted companies permanently diluting shareholders because lenders force them to raise capital at a distressed price. Of course, plenty of companies use debt to fund growth, without any negative consequences. The first step when considering a company's debt levels is to consider its cash and debt together.
See our latest analysis for ESCO Technologies
What Is ESCO Technologies's Debt?
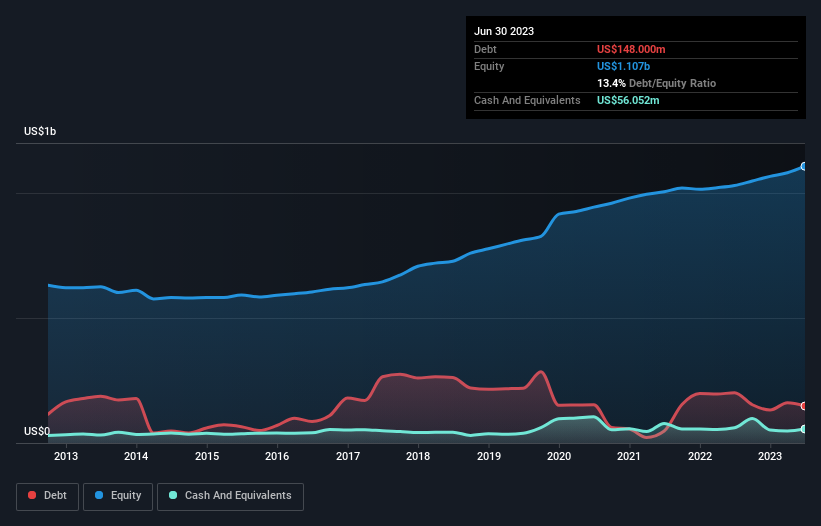
As you can see below, ESCO Technologies had US$148.0m of debt at June 2023, down from US$201.0m a year prior. However, it also had US$56.1m in cash, and so its net debt is US$91.9m.
How Healthy Is ESCO Technologies' Balance Sheet?
Zooming in on the latest balance sheet data, we can see that ESCO Technologies had liabilities of US$309.0m due within 12 months and liabilities of US$287.5m due beyond that. Offsetting this, it had US$56.1m in cash and US$320.4m in receivables that were due within 12 months. So its liabilities outweigh the sum of its cash and (near-term) receivables by US$220.0m.
Since publicly traded ESCO Technologies shares are worth a total of US$2.62b, it seems unlikely that this level of liabilities would be a major threat. But there are sufficient liabilities that we would certainly recommend shareholders continue to monitor the balance sheet, going forward.
We use two main ratios to inform us about debt levels relative to earnings. The first is net debt divided by earnings before interest, tax, depreciation, and amortization (EBITDA), while the second is how many times its earnings before interest and tax (EBIT) covers its interest expense (or its interest cover, for short). The advantage of this approach is that we take into account both the absolute quantum of debt (with net debt to EBITDA) and the actual interest expenses associated with that debt (with its interest cover ratio).
ESCO Technologies's net debt is only 0.52 times its EBITDA. And its EBIT covers its interest expense a whopping 15.7 times over. So we're pretty relaxed about its super-conservative use of debt. On top of that, ESCO Technologies grew its EBIT by 36% over the last twelve months, and that growth will make it easier to handle its debt. The balance sheet is clearly the area to focus on when you are analysing debt. But it is future earnings, more than anything, that will determine ESCO Technologies's ability to maintain a healthy balance sheet going forward. So if you're focused on the future you can check out this free report showing analyst profit forecasts.
Finally, while the tax-man may adore accounting profits, lenders only accept cold hard cash. So the logical step is to look at the proportion of that EBIT that is matched by actual free cash flow. During the last three years, ESCO Technologies produced sturdy free cash flow equating to 71% of its EBIT, about what we'd expect. This free cash flow puts the company in a good position to pay down debt, when appropriate.
Our View
Happily, ESCO Technologies's impressive interest cover implies it has the upper hand on its debt. And that's just the beginning of the good news since its EBIT growth rate is also very heartening. Overall, we don't think ESCO Technologies is taking any bad risks, as its debt load seems modest. So we're not worried about the use of a little leverage on the balance sheet. Above most other metrics, we think its important to track how fast earnings per share is growing, if at all. If you've also come to that realization, you're in luck, because today you can view this interactive graph of ESCO Technologies's earnings per share history for free.
If you're interested in investing in businesses that can grow profits without the burden of debt, then check out this free list of growing businesses that have net cash on the balance sheet.
Valuation is complex, but we're here to simplify it.
Discover if ESCO Technologies might be undervalued or overvalued with our detailed analysis, featuring fair value estimates, potential risks, dividends, insider trades, and its financial condition.
Access Free AnalysisHave feedback on this article? Concerned about the content? Get in touch with us directly. Alternatively, email editorial-team (at) simplywallst.com.
This article by Simply Wall St is general in nature. We provide commentary based on historical data and analyst forecasts only using an unbiased methodology and our articles are not intended to be financial advice. It does not constitute a recommendation to buy or sell any stock, and does not take account of your objectives, or your financial situation. We aim to bring you long-term focused analysis driven by fundamental data. Note that our analysis may not factor in the latest price-sensitive company announcements or qualitative material. Simply Wall St has no position in any stocks mentioned.
About NYSE:ESE
ESCO Technologies
Provides engineered filtration and fluid control products, and integrated propulsion systems worldwide.
Flawless balance sheet with reasonable growth potential.
Similar Companies
Market Insights

Community Narratives

