Advertisement
- United States
- /
- Machinery
- /
- NYSE:ESAB
How Should Investors View ESAB After Its Recent 8% Weekly Surge in 2025?

Simply Wall St
Reviewed by Bailey Pemberton
If you are looking at ESAB and wondering whether to buy, hold, or walk away, you are not alone. The company has caught the eye of many investors recently, as its stock closed at $118.64 and has put in an impressive 8.2% gain over the last week. Over one year, ESAB shares are up 15.6%, and if you zoom out to three years, the returns become even more striking at 265.3%. That kind of growth prompts a fresh look at what is driving investor optimism, especially given how the broader industrial market has shifted in response to changing global supply chains and manufacturing trends.
What is particularly interesting about ESAB right now is that, despite its strong run, a quick valuation check suggests the company is undervalued in just one out of six key measures. This gives it a valuation score of 1. This hints at growing optimism, but also suggests some caution might be warranted if you are hoping to spot an overlooked bargain. Still, big moves sometimes precede further gains, especially when a company is executing well and adapting to market shifts.
So how do those valuation checks work, and do they capture the full story of ESAB’s investment potential? In the next section, we will break down the most popular valuation measures and what they say about ESAB today. Stick around, because after the numbers, we will look at a smarter way to judge stock value that many people overlook.
ESAB scores just 1/6 on our valuation checks. See what other red flags we found in the full valuation breakdown.
Approach 1: ESAB Discounted Cash Flow (DCF) Analysis
The Discounted Cash Flow (DCF) model estimates a company's intrinsic value by projecting its future cash flows and discounting them back to their present value. This approach helps investors determine what a stock should be worth, based on its expected ability to generate cash over the years.
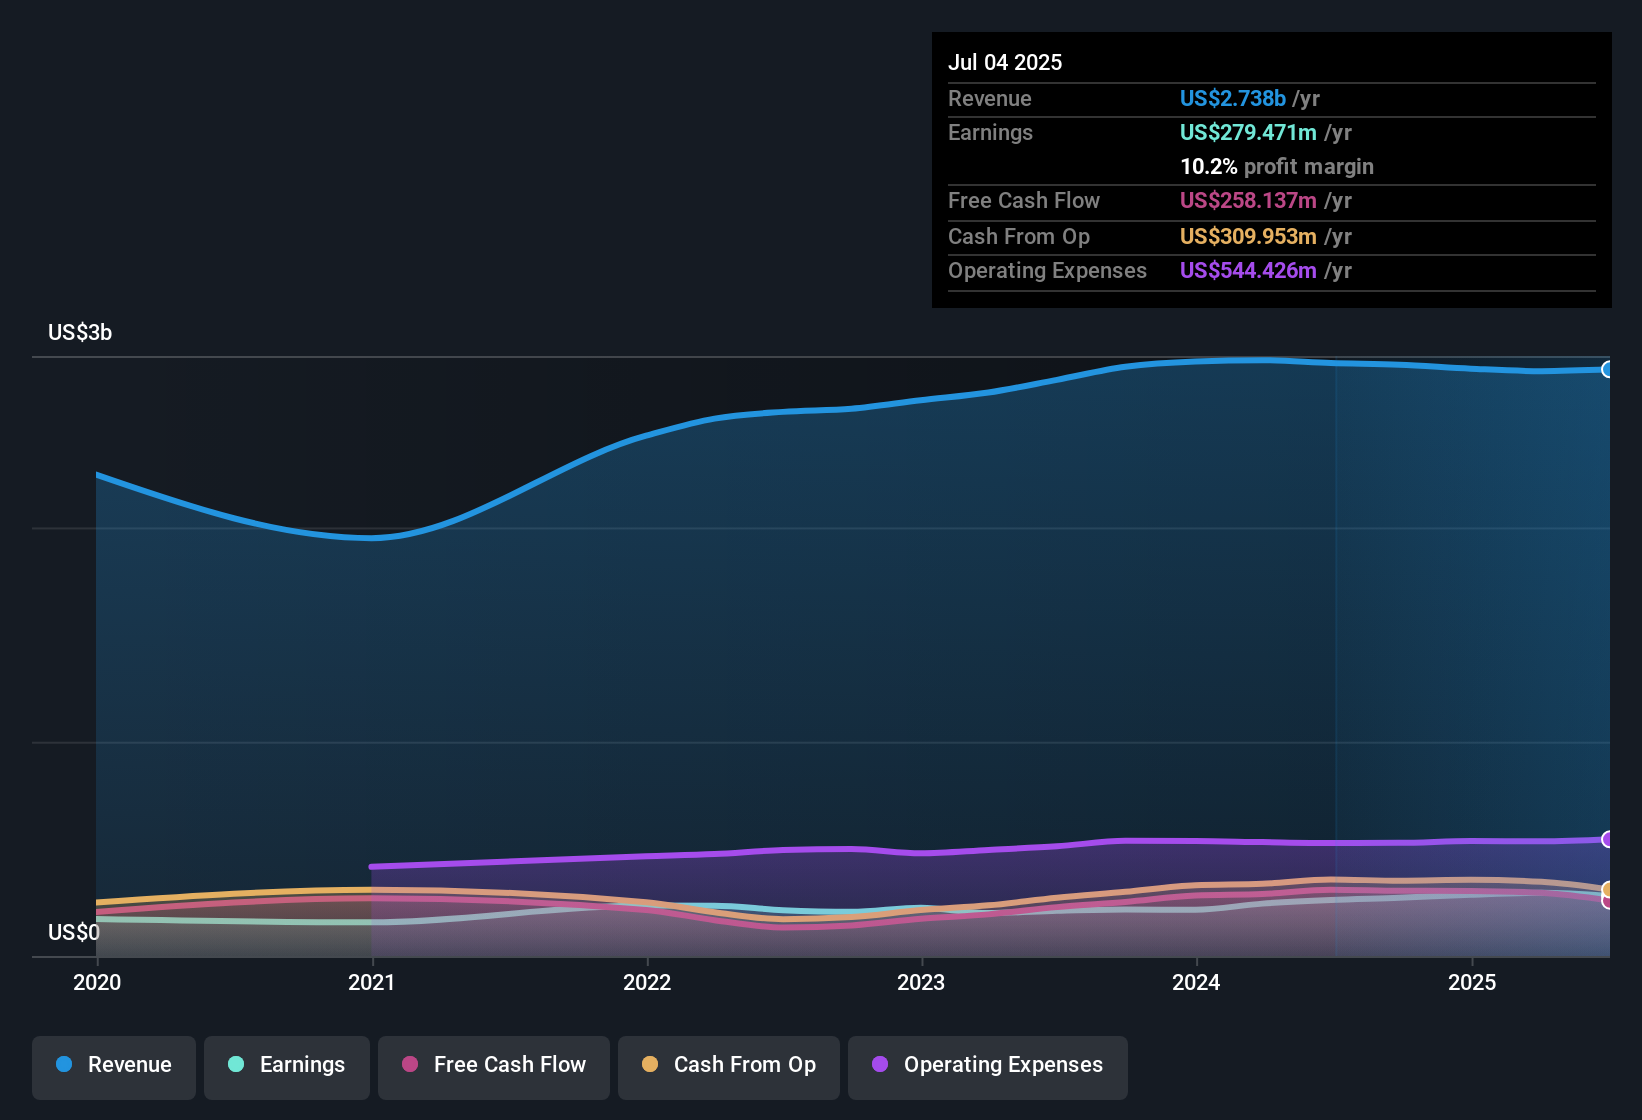
For ESAB, the current Free Cash Flow stands at $262 million. Analysts provide specific cash flow estimates for the next five years, with projections such as $374 million in 2026 and $464 million in 2029. Beyond those years, Simply Wall St extrapolates additional forecasts and estimates Free Cash Flow to reach nearly $599 million by 2035. All these figures are denominated in U.S. dollars.
According to this DCF analysis, ESAB's fair value is approximately $136.35 per share. With the current market price at $118.64, the model suggests the stock is about 13.0% undervalued. This means the market may not be fully appreciating the company’s future earnings potential at present.
Result: UNDERVALUED
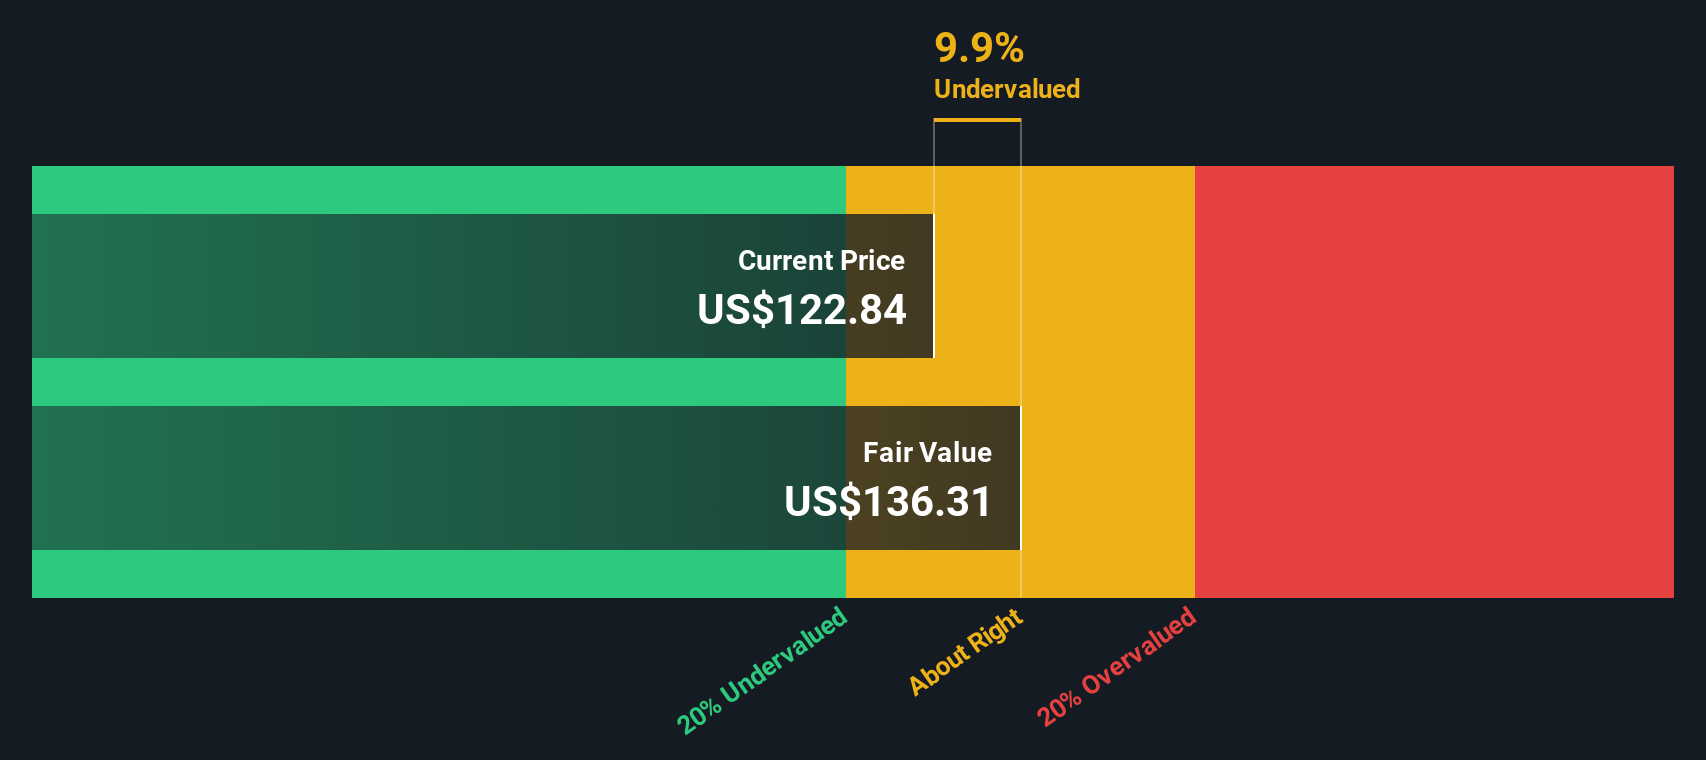
Our Discounted Cash Flow (DCF) analysis suggests ESAB is undervalued by 13.0%. Track this in your watchlist or portfolio, or discover more undervalued stocks.
Approach 2: ESAB Price vs Earnings
The Price-to-Earnings (PE) ratio is a widely used valuation metric for profitable companies like ESAB because it directly relates a company’s stock price to its earnings power. For investors, the PE ratio serves as a straightforward way to compare how much they are paying for each dollar of earnings. This makes it especially useful for evaluating established, consistently profitable businesses.
However, it is important to remember that what counts as a “normal” or “fair” PE ratio can vary depending on expectations for growth and the level of risk. Fast-growing companies generally warrant higher PE ratios, reflecting their potential for future earnings expansion. In contrast, riskier or slower-growing companies typically trade at lower multiples.
Currently, ESAB trades on a PE ratio of 25.8x. This compares to an industry average of 24.1x for the Machinery sector and a peer group average of 24.7x. On the surface, ESAB’s valuation looks just a touch above these benchmarks. There is also a more nuanced way to assess value using the Fair Ratio, which is a proprietary metric that blends in factors such as ESAB’s expected earnings growth, profit margins, market cap and associated risks, as well as its industry characteristics. For ESAB, this Fair Ratio is calculated at 25.2x.
Unlike a simple comparison to industry or peer averages, the Fair Ratio goes deeper by adjusting for specifics that can make a material difference to fair value. This approach can help explain why a company may warrant a premium or deserve a discount versus its peers, offering a clearer sense of whether the current PE reflects its true prospects.
With ESAB’s current PE ratio of 25.8x very close to the Fair Ratio of 25.2x, the stock appears to be valued about right based on its financial performance and outlook.
Result: ABOUT RIGHT

PE ratios tell one story, but what if the real opportunity lies elsewhere? Discover companies where insiders are betting big on explosive growth.
Upgrade Your Decision Making: Choose your ESAB Narrative
Earlier, we mentioned that there's an even better way to understand valuation. Let's introduce you to Narratives. Narratives are a new, user-friendly way for investors to shape their own story about a company, combining their personal view on ESAB’s business strengths, future revenues, margins, and risks with a tailored financial forecast and an up-to-date fair value.
Rather than focusing just on ratios, a Narrative connects your reasoning from ESAB’s market position or expansion plans to recent earnings reports directly to future performance and what the shares are worth today. This makes Narratives a dynamic decision tool on Simply Wall St’s Community page, where millions of investors share and compare perspectives.
By setting your expected fair value and forecasts, Narratives help you clarify exactly when ESAB looks buyable or worth selling, all while instantly reflecting the latest news or company results so your view stays relevant and in sync with reality.
For example, right now some users, looking at robust automation demand in Asia-Pacific and higher EBITDA margins, see fair value as high as $150, while others are more cautious, with values as low as $118 if global trade risks and cyclicality bite harder than expected.
Do you think there's more to the story for ESAB? Create your own Narrative to let the Community know!
This article by Simply Wall St is general in nature. We provide commentary based on historical data and analyst forecasts only using an unbiased methodology and our articles are not intended to be financial advice. It does not constitute a recommendation to buy or sell any stock, and does not take account of your objectives, or your financial situation. We aim to bring you long-term focused analysis driven by fundamental data. Note that our analysis may not factor in the latest price-sensitive company announcements or qualitative material. Simply Wall St has no position in any stocks mentioned.
Valuation is complex, but we're here to simplify it.
Discover if ESAB might be undervalued or overvalued with our detailed analysis, featuring fair value estimates, potential risks, dividends, insider trades, and its financial condition.
Access Free AnalysisHave feedback on this article? Concerned about the content? Get in touch with us directly. Alternatively, email editorial-team@simplywallst.com
About NYSE:ESAB
ESAB
Engages in the formulation, development, manufacture, and supply of consumable products and equipment for use in cutting, joining, automated welding, and gas control equipment.
Proven track record with adequate balance sheet.
Similar Companies
Market Insights

Advertisement
Community Narratives
Finding The True Value Of A Logistics Powerhouse
Fair Value US$95.21|7.5% undervalued
NV
Community Contributor
Paradigm Biopharmaceuticals Will Lead Osteoarthritis Treatment with Zilosul's FDA Success
Fair Value AU$5.50|93.3% undervalued
AM
Community Contributor
Barrick Mining (ABX:CA): A Gold Hedge against a U.S. Shutdown
Fair Value CA$60.00|26.4% undervalued
GM
Community Contributor