
Advertisement
- United States
- /
- Machinery
- /
- NYSE:EPAC
We Think Enerpac Tool Group (NYSE:EPAC) Can Stay On Top Of Its Debt
Warren Buffett famously said, 'Volatility is far from synonymous with risk.' It's only natural to consider a company's balance sheet when you examine how risky it is, since debt is often involved when a business collapses. Importantly, Enerpac Tool Group Corp. (NYSE:EPAC) does carry debt. But the more important question is: how much risk is that debt creating?
Why Does Debt Bring Risk?
Debt assists a business until the business has trouble paying it off, either with new capital or with free cash flow. Ultimately, if the company can't fulfill its legal obligations to repay debt, shareholders could walk away with nothing. However, a more usual (but still expensive) situation is where a company must dilute shareholders at a cheap share price simply to get debt under control. Of course, plenty of companies use debt to fund growth, without any negative consequences. The first step when considering a company's debt levels is to consider its cash and debt together.
How Much Debt Does Enerpac Tool Group Carry?
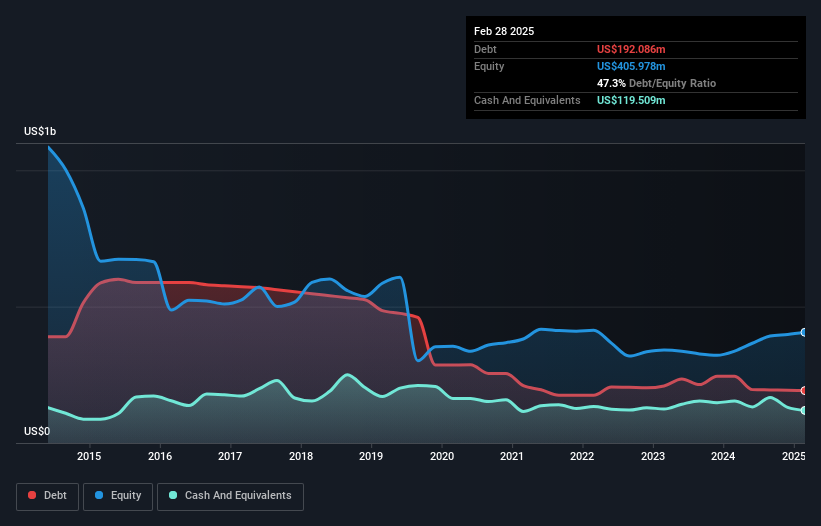
As you can see below, Enerpac Tool Group had US$192.1m of debt at February 2025, down from US$244.9m a year prior. However, it does have US$119.5m in cash offsetting this, leading to net debt of about US$72.6m.
How Strong Is Enerpac Tool Group's Balance Sheet?
We can see from the most recent balance sheet that Enerpac Tool Group had liabilities of US$114.0m falling due within a year, and liabilities of US$256.6m due beyond that. Offsetting these obligations, it had cash of US$119.5m as well as receivables valued at US$115.0m due within 12 months. So its liabilities outweigh the sum of its cash and (near-term) receivables by US$136.2m.
Given Enerpac Tool Group has a market capitalization of US$2.15b, it's hard to believe these liabilities pose much threat. However, we do think it is worth keeping an eye on its balance sheet strength, as it may change over time.
See our latest analysis for Enerpac Tool Group
We use two main ratios to inform us about debt levels relative to earnings. The first is net debt divided by earnings before interest, tax, depreciation, and amortization (EBITDA), while the second is how many times its earnings before interest and tax (EBIT) covers its interest expense (or its interest cover, for short). Thus we consider debt relative to earnings both with and without depreciation and amortization expenses.
Enerpac Tool Group has a low net debt to EBITDA ratio of only 0.49. And its EBIT covers its interest expense a whopping 13.1 times over. So we're pretty relaxed about its super-conservative use of debt. The good news is that Enerpac Tool Group has increased its EBIT by 2.2% over twelve months, which should ease any concerns about debt repayment. When analysing debt levels, the balance sheet is the obvious place to start. But it is future earnings, more than anything, that will determine Enerpac Tool Group's ability to maintain a healthy balance sheet going forward. So if you want to see what the professionals think, you might find this free report on analyst profit forecasts to be interesting.
Finally, while the tax-man may adore accounting profits, lenders only accept cold hard cash. So it's worth checking how much of that EBIT is backed by free cash flow. During the last three years, Enerpac Tool Group produced sturdy free cash flow equating to 53% of its EBIT, about what we'd expect. This free cash flow puts the company in a good position to pay down debt, when appropriate.
Our View
Happily, Enerpac Tool Group's impressive interest cover implies it has the upper hand on its debt. And that's just the beginning of the good news since its net debt to EBITDA is also very heartening. When we consider the range of factors above, it looks like Enerpac Tool Group is pretty sensible with its use of debt. That means they are taking on a bit more risk, in the hope of boosting shareholder returns. Over time, share prices tend to follow earnings per share, so if you're interested in Enerpac Tool Group, you may well want to click here to check an interactive graph of its earnings per share history .
If, after all that, you're more interested in a fast growing company with a rock-solid balance sheet, then check out our list of net cash growth stocks without delay.
Valuation is complex, but we're here to simplify it.
Discover if Enerpac Tool Group might be undervalued or overvalued with our detailed analysis, featuring fair value estimates, potential risks, dividends, insider trades, and its financial condition.
Access Free AnalysisHave feedback on this article? Concerned about the content? Get in touch with us directly. Alternatively, email editorial-team (at) simplywallst.com.
This article by Simply Wall St is general in nature. We provide commentary based on historical data and analyst forecasts only using an unbiased methodology and our articles are not intended to be financial advice. It does not constitute a recommendation to buy or sell any stock, and does not take account of your objectives, or your financial situation. We aim to bring you long-term focused analysis driven by fundamental data. Note that our analysis may not factor in the latest price-sensitive company announcements or qualitative material. Simply Wall St has no position in any stocks mentioned.
About NYSE:EPAC
Enerpac Tool Group
Manufactures and sells a range of industrial products and solutions in the United States, the United Kingdom, Germany, Australia, Canada, China, Saudi Arabia, Brazil, France, and internationally.
Flawless balance sheet with solid track record.
Similar Companies
Market Insights

Advertisement
Community Narratives
Quality at a Premium. A time to watch, not to buy?
Fair Value US$154.56|29.0% undervalued
DA
Community Contributor
GRAB: The Super-App at the Heart of Southeast Asia’s Digital Boom
Fair Value US$8.20|22.6% undervalued
BL
Community Contributor
Verve Group to Surge with 51.61% Revenue Growth
Fair Value €6.00|60.1% undervalued
ME
Community Contributor