
Advertisement
- United States
- /
- Electrical
- /
- NYSE:ENS
A Sliding Share Price Has Us Looking At EnerSys's (NYSE:ENS) P/E Ratio

To the annoyance of some shareholders, EnerSys (NYSE:ENS) shares are down a considerable 34% in the last month. The recent drop has obliterated the annual return, with the share price now down 25% over that longer period.
All else being equal, a share price drop should make a stock more attractive to potential investors. In the long term, share prices tend to follow earnings per share, but in the short term prices bounce around in response to short term factors (which are not always obvious). The implication here is that long term investors have an opportunity when expectations of a company are too low. Perhaps the simplest way to get a read on investors' expectations of a business is to look at its Price to Earnings Ratio (PE Ratio). Investors have optimistic expectations of companies with higher P/E ratios, compared to companies with lower P/E ratios.
Check out our latest analysis for EnerSys
How Does EnerSys's P/E Ratio Compare To Its Peers?
EnerSys's P/E of 13.64 indicates relatively low sentiment towards the stock. We can see in the image below that the average P/E (17.4) for companies in the electrical industry is higher than EnerSys's P/E.
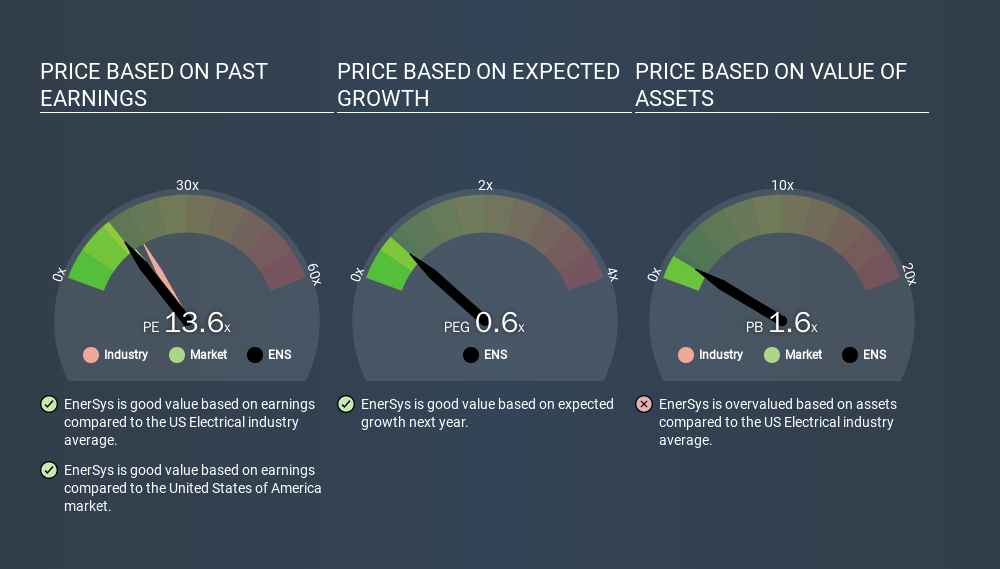
Its relatively low P/E ratio indicates that EnerSys shareholders think it will struggle to do as well as other companies in its industry classification. Since the market seems unimpressed with EnerSys, it's quite possible it could surprise on the upside. It is arguably worth checking if insiders are buying shares, because that might imply they believe the stock is undervalued.
How Growth Rates Impact P/E Ratios
Probably the most important factor in determining what P/E a company trades on is the earnings growth. If earnings are growing quickly, then the 'E' in the equation will increase faster than it would otherwise. That means unless the share price increases, the P/E will reduce in a few years. A lower P/E should indicate the stock is cheap relative to others -- and that may attract buyers.
EnerSys shrunk earnings per share by 20% over the last year. But it has grown its earnings per share by 5.7% per year over the last three years.
Remember: P/E Ratios Don't Consider The Balance Sheet
The 'Price' in P/E reflects the market capitalization of the company. Thus, the metric does not reflect cash or debt held by the company. In theory, a company can lower its future P/E ratio by using cash or debt to invest in growth.
Spending on growth might be good or bad a few years later, but the point is that the P/E ratio does not account for the option (or lack thereof).
EnerSys's Balance Sheet
EnerSys's net debt equates to 39% of its market capitalization. While it's worth keeping this in mind, it isn't a worry.
The Verdict On EnerSys's P/E Ratio
EnerSys has a P/E of 13.6. That's around the same as the average in the US market, which is 14.7. Given it has some debt, but didn't grow last year, the P/E indicates the market is expecting higher profits ahead for the business. Given EnerSys's P/E ratio has declined from 20.7 to 13.6 in the last month, we know for sure that the market is significantly less confident about the business today, than it was back then. For those who prefer to invest with the flow of momentum, that might be a bad sign, but for a contrarian, it may signal opportunity.
When the market is wrong about a stock, it gives savvy investors an opportunity. If the reality for a company is not as bad as the P/E ratio indicates, then the share price should increase as the market realizes this. So this free visualization of the analyst consensus on future earnings could help you make the right decision about whether to buy, sell, or hold.
Of course, you might find a fantastic investment by looking at a few good candidates. So take a peek at this free list of companies with modest (or no) debt, trading on a P/E below 20.
If you spot an error that warrants correction, please contact the editor at editorial-team@simplywallst.com. This article by Simply Wall St is general in nature. It does not constitute a recommendation to buy or sell any stock, and does not take account of your objectives, or your financial situation. Simply Wall St has no position in the stocks mentioned.
We aim to bring you long-term focused research analysis driven by fundamental data. Note that our analysis may not factor in the latest price-sensitive company announcements or qualitative material. Thank you for reading.
About NYSE:ENS
EnerSys
Engages in the provision of stored energy solutions for industrial applications worldwide.
Solid track record with excellent balance sheet and pays a dividend.
Similar Companies
Market Insights


Advertisement
Community Narratives
The Future of Drug Testing? Fingerprint Tech Shows Serious Promise
Fair Value US$2.98|38.6% undervalued
JO
Community Contributor
Suncorp’s Next Chapter: Insurance-Only and Ready to Grow
Fair Value AU$22.83|8.8% undervalued
RO
Community Contributor
Thyssenkrupp Nucera Will Achieve Double-Digit Profits by 2030 Boosted by Hydrogen Growth
Fair Value €14.40|31.6% undervalued
CH
Community Contributor
Tesla’s Nvidia Moment – The AI & Robotics Inflection Point
Fair Value US$384.84|18.0% undervalued
BL
Community Contributor