- United States
- /
- Construction
- /
- NYSE:EME
Are Strong Financial Prospects The Force That Is Driving The Momentum In EMCOR Group, Inc.'s NYSE:EME) Stock?


EMCOR Group (NYSE:EME) has had a great run on the share market with its stock up by a significant 8.2% over the last month. Given the company's impressive performance, we decided to study its financial indicators more closely as a company's financial health over the long-term usually dictates market outcomes. Specifically, we decided to study EMCOR Group's ROE in this article.
Return on equity or ROE is a key measure used to assess how efficiently a company's management is utilizing the company's capital. In short, ROE shows the profit each dollar generates with respect to its shareholder investments.
Check out our latest analysis for EMCOR Group
How Do You Calculate Return On Equity?
ROE can be calculated by using the formula:
Return on Equity = Net Profit (from continuing operations) ÷ Shareholders' Equity
So, based on the above formula, the ROE for EMCOR Group is:
21% = US$444m ÷ US$2.1b (Based on the trailing twelve months to March 2023).
The 'return' is the profit over the last twelve months. So, this means that for every $1 of its shareholder's investments, the company generates a profit of $0.21.
What Has ROE Got To Do With Earnings Growth?
We have already established that ROE serves as an efficient profit-generating gauge for a company's future earnings. We now need to evaluate how much profit the company reinvests or "retains" for future growth which then gives us an idea about the growth potential of the company. Generally speaking, other things being equal, firms with a high return on equity and profit retention, have a higher growth rate than firms that don’t share these attributes.
EMCOR Group's Earnings Growth And 21% ROE
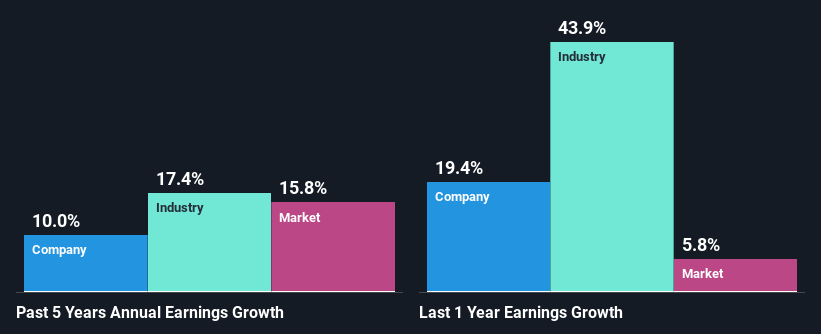
To start with, EMCOR Group's ROE looks acceptable. On comparing with the average industry ROE of 12% the company's ROE looks pretty remarkable. Probably as a result of this, EMCOR Group was able to see a decent growth of 10.0% over the last five years.
We then compared EMCOR Group's net income growth with the industry and found that the company's growth figure is lower than the average industry growth rate of 17% in the same period, which is a bit concerning.
The basis for attaching value to a company is, to a great extent, tied to its earnings growth. It’s important for an investor to know whether the market has priced in the company's expected earnings growth (or decline). This then helps them determine if the stock is placed for a bright or bleak future. Has the market priced in the future outlook for EME? You can find out in our latest intrinsic value infographic research report.
Is EMCOR Group Using Its Retained Earnings Effectively?
EMCOR Group's three-year median payout ratio to shareholders is 7.8% (implying that it retains 92% of its income), which is on the lower side, so it seems like the management is reinvesting profits heavily to grow its business.
Moreover, EMCOR Group is determined to keep sharing its profits with shareholders which we infer from its long history of paying a dividend for at least ten years.
Conclusion
In total, we are pretty happy with EMCOR Group's performance. In particular, it's great to see that the company is investing heavily into its business and along with a high rate of return, that has resulted in a respectable growth in its earnings. On studying current analyst estimates, we found that analysts expect the company to continue its recent growth streak. Are these analysts expectations based on the broad expectations for the industry, or on the company's fundamentals? Click here to be taken to our analyst's forecasts page for the company.
Valuation is complex, but we're here to simplify it.
Discover if EMCOR Group might be undervalued or overvalued with our detailed analysis, featuring fair value estimates, potential risks, dividends, insider trades, and its financial condition.
Access Free AnalysisHave feedback on this article? Concerned about the content? Get in touch with us directly. Alternatively, email editorial-team (at) simplywallst.com.
This article by Simply Wall St is general in nature. We provide commentary based on historical data and analyst forecasts only using an unbiased methodology and our articles are not intended to be financial advice. It does not constitute a recommendation to buy or sell any stock, and does not take account of your objectives, or your financial situation. We aim to bring you long-term focused analysis driven by fundamental data. Note that our analysis may not factor in the latest price-sensitive company announcements or qualitative material. Simply Wall St has no position in any stocks mentioned.
About NYSE:EME
EMCOR Group
Provides electrical and mechanical construction and facilities, building, and industrial services in the United States and the United Kingdom.
Outstanding track record with flawless balance sheet.
Similar Companies
Market Insights

Community Narratives

