Advertisement
- United States
- /
- Building
- /
- NYSE:CARR
Carrier (CARR): Earnings Decline and Margin Compression Challenge Bullish Growth Narrative

Simply Wall St
Reviewed by Simply Wall St
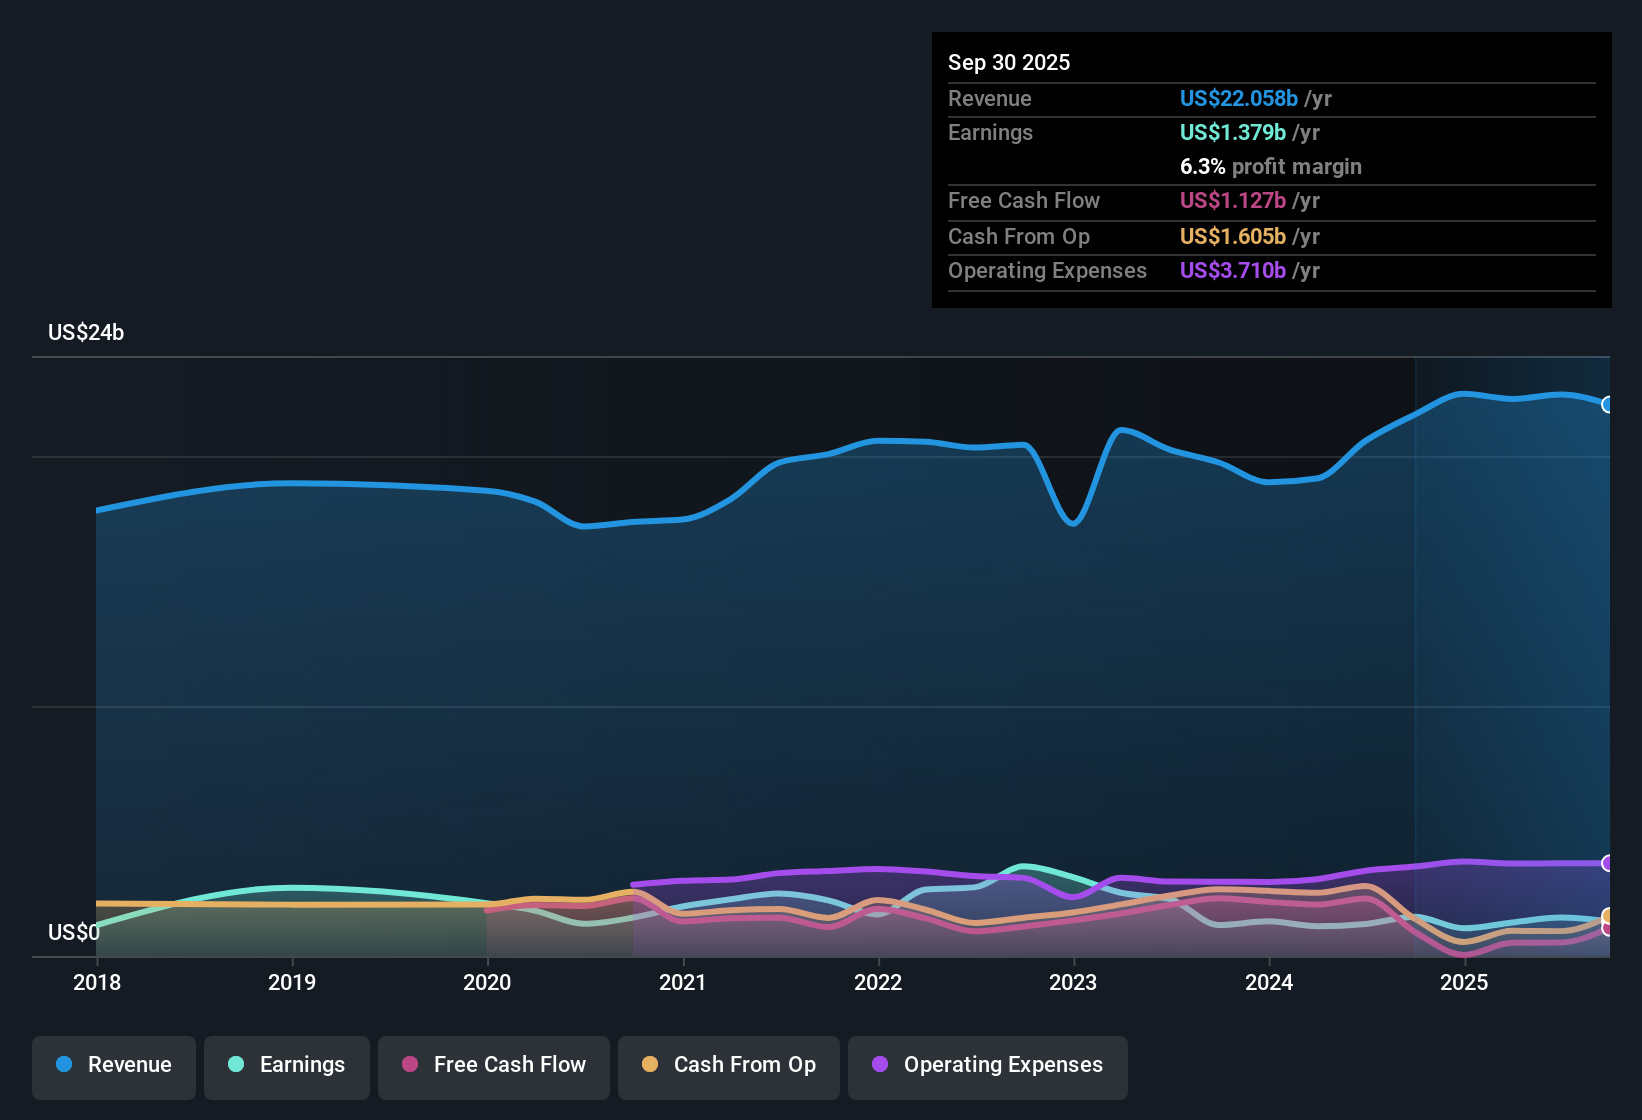
Carrier Global (CARR) reported that earnings have declined by 11.7% per year over the past five years, and net profit margins now sit at 6.3%, below last year's 7.3%. Despite these headwinds, the company’s earnings are projected to grow at an impressive 23.5% per year, outpacing the broader US market’s 15.6% forecast. Investors are weighing the promise of accelerating earnings growth against the backdrop of historical profit declines and ongoing balance sheet concerns.
See our full analysis for Carrier Global.The next section will stack these results up against the market’s most widely discussed narratives, highlighting where the numbers confirm expectations and where surprises may surface.
See what the community is saying about Carrier Global
Profit Margin Forecast: 6.8% to 10.9%
- Analysts expect Carrier Global’s profit margins to rise sharply from 6.8% now to 10.9% over the next three years. This outlook outpaces many industry peers and reflects the anticipated benefits of new service offerings and operational efficiencies.
- Analysts' consensus view suggests this increase in margins will be powered by double-digit aftermarket service growth and strategic European expansion.
- Cost synergies from the Viessmann acquisition and a push into high-demand data center cooling are seen as key drivers boosting profitability.
- The forecasted jump in margins stands in contrast to historic margin compression and recent weakness in certain global segments, which challenges skeptics who worry about sustainability.
Consensus sees Carrier ready to break away from its past profit slump, but does the reality match the hype? 📊 Read the full Carrier Global Consensus Narrative.
PE Ratio Signals Potential Value Mismatch
- With a current PE ratio of 37.5x, Carrier trades above both the peer average of 28.2x and the US Building industry average of 20.9x. The share price of $60.75 still sits below the official target price of $73.24 and below its DCF fair value of $75.63.
- Analysts' consensus narrative flags an unusual disconnect.
- Despite the high multiple, 2028 projections assume a reduction in PE to 26.6x, which remains above industry norms even as profit improves.
- This setup draws bulls who see a discount versus fair value and next-three-year upside, while bears may argue that premium multiples require flawless execution amid financial and segment risks.
Balance Sheet Risks Remain Front and Center
- The major red flag for skeptics is Carrier’s weak financial position. The EDGAR summary emphasizes this as the standout company risk in the outlook for future cash flow and valuation.
- Analysts' consensus narrative underscores how this risk weighs against strong margin and revenue growth forecasts.
- Balance sheet concerns could cap upside if international segment challenges, currency headwinds, or unmitigated tariffs further squeeze cash or profitability.
- Any stumble in delivering cost synergies or operational improvements may quickly turn investor focus from the bullish growth narrative to questions about balance sheet durability.
Next Steps
To see how these results tie into long-term growth, risks, and valuation, check out the full range of community narratives for Carrier Global on Simply Wall St. Add the company to your watchlist or portfolio so you'll be alerted when the story evolves.
Looking at these figures from a fresh angle? Take just a couple of minutes to shape your own take and share your perspective, then Do it your way.
A great starting point for your Carrier Global research is our analysis highlighting 3 key rewards and 1 important warning sign that could impact your investment decision.
See What Else Is Out There
Carrier Global’s growth projections are clouded by persistent balance sheet risks and financial strength that is below average compared to peers.
If you want companies that prioritize stability and are less exposed to sudden financial shocks, take a look at solid balance sheet and fundamentals stocks screener (1980 results) that might better fit your requirements.
This article by Simply Wall St is general in nature. We provide commentary based on historical data and analyst forecasts only using an unbiased methodology and our articles are not intended to be financial advice. It does not constitute a recommendation to buy or sell any stock, and does not take account of your objectives, or your financial situation. We aim to bring you long-term focused analysis driven by fundamental data. Note that our analysis may not factor in the latest price-sensitive company announcements or qualitative material. Simply Wall St has no position in any stocks mentioned.
New: AI Stock Screener & Alerts
Our new AI Stock Screener scans the market every day to uncover opportunities.
• Dividend Powerhouses (3%+ Yield)
• Undervalued Small Caps with Insider Buying
• High growth Tech and AI Companies
Or build your own from over 50 metrics.
Have feedback on this article? Concerned about the content? Get in touch with us directly. Alternatively, email editorial-team@simplywallst.com
About NYSE:CARR
Carrier Global
Provides intelligent climate and energy solutions in the United States, Europe, the Asia Pacific, and internationally.
Fair value with moderate growth potential.
Similar Companies
Market Insights

Advertisement
Community Narratives
The company that turned a verb into a global necessity and basically runs the modern internet, digital ads, smartphones, maps, and AI.
Fair Value US$300.00|8.5% undervalued
OS
Community Contributor
Flowers Foods Pays A Fair Price For Health
Fair Value US$16.12|24.6% undervalued
NV
Community Contributor
TMX Group will thrive with 33.3% profit margin and enduring market moat
Fair Value CA$49.90|0.1% undervalued
LI
Community Contributor