- United States
- /
- Trade Distributors
- /
- NYSE:BXC
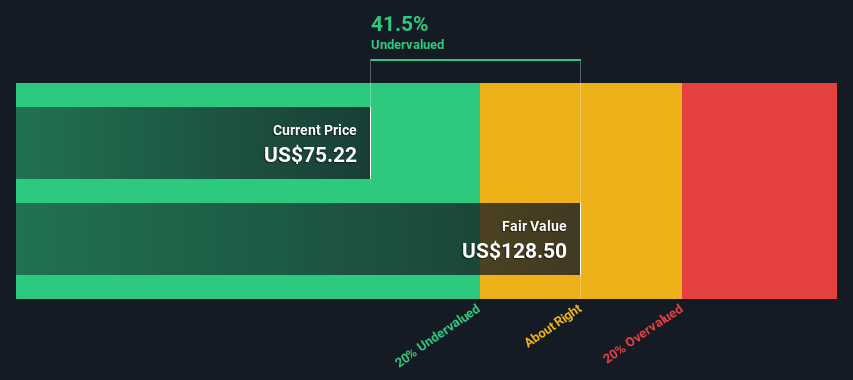
BlueLinx Holdings Inc. (NYSE:BXC) Shares Could Be 41% Below Their Intrinsic Value Estimate


Key Insights
- Using the 2 Stage Free Cash Flow to Equity, BlueLinx Holdings fair value estimate is US$129
- BlueLinx Holdings' US$75.22 share price signals that it might be 41% undervalued
- Analyst price target for BXC is US$105 which is 19% below our fair value estimate
Today we will run through one way of estimating the intrinsic value of BlueLinx Holdings Inc. (NYSE:BXC) by taking the expected future cash flows and discounting them to today's value. The Discounted Cash Flow (DCF) model is the tool we will apply to do this. Models like these may appear beyond the comprehension of a lay person, but they're fairly easy to follow.
We would caution that there are many ways of valuing a company and, like the DCF, each technique has advantages and disadvantages in certain scenarios. Anyone interested in learning a bit more about intrinsic value should have a read of the Simply Wall St analysis model.
See our latest analysis for BlueLinx Holdings
The Method
We are going to use a two-stage DCF model, which, as the name states, takes into account two stages of growth. The first stage is generally a higher growth period which levels off heading towards the terminal value, captured in the second 'steady growth' period. In the first stage we need to estimate the cash flows to the business over the next ten years. Where possible we use analyst estimates, but when these aren't available we extrapolate the previous free cash flow (FCF) from the last estimate or reported value. We assume companies with shrinking free cash flow will slow their rate of shrinkage, and that companies with growing free cash flow will see their growth rate slow, over this period. We do this to reflect that growth tends to slow more in the early years than it does in later years.
Generally we assume that a dollar today is more valuable than a dollar in the future, and so the sum of these future cash flows is then discounted to today's value:
10-year free cash flow (FCF) estimate
| 2023 | 2024 | 2025 | 2026 | 2027 | 2028 | 2029 | 2030 | 2031 | 2032 | |
| Levered FCF ($, Millions) | US$146.3m | US$129.3m | US$119.8m | US$114.4m | US$111.5m | US$110.3m | US$110.1m | US$110.7m | US$111.8m | US$113.3m |
| Growth Rate Estimate Source | Analyst x2 | Analyst x3 | Est @ -7.32% | Est @ -4.49% | Est @ -2.51% | Est @ -1.13% | Est @ -0.15% | Est @ 0.52% | Est @ 1.00% | Est @ 1.33% |
| Present Value ($, Millions) Discounted @ 11% | US$132 | US$105 | US$87.6 | US$75.4 | US$66.2 | US$59.0 | US$53.0 | US$48.0 | US$43.7 | US$39.9 |
("Est" = FCF growth rate estimated by Simply Wall St)
Present Value of 10-year Cash Flow (PVCF) = US$710m
The second stage is also known as Terminal Value, this is the business's cash flow after the first stage. The Gordon Growth formula is used to calculate Terminal Value at a future annual growth rate equal to the 5-year average of the 10-year government bond yield of 2.1%. We discount the terminal cash flows to today's value at a cost of equity of 11%.
Terminal Value (TV)= FCF2032 × (1 + g) ÷ (r – g) = US$113m× (1 + 2.1%) ÷ (11%– 2.1%) = US$1.3b
Present Value of Terminal Value (PVTV)= TV / (1 + r)10= US$1.3b÷ ( 1 + 11%)10= US$458m
The total value, or equity value, is then the sum of the present value of the future cash flows, which in this case is US$1.2b. To get the intrinsic value per share, we divide this by the total number of shares outstanding. Compared to the current share price of US$75.2, the company appears quite good value at a 41% discount to where the stock price trades currently. The assumptions in any calculation have a big impact on the valuation, so it is better to view this as a rough estimate, not precise down to the last cent.
Important Assumptions
We would point out that the most important inputs to a discounted cash flow are the discount rate and of course the actual cash flows. If you don't agree with these result, have a go at the calculation yourself and play with the assumptions. The DCF also does not consider the possible cyclicality of an industry, or a company's future capital requirements, so it does not give a full picture of a company's potential performance. Given that we are looking at BlueLinx Holdings as potential shareholders, the cost of equity is used as the discount rate, rather than the cost of capital (or weighted average cost of capital, WACC) which accounts for debt. In this calculation we've used 11%, which is based on a levered beta of 1.496. Beta is a measure of a stock's volatility, compared to the market as a whole. We get our beta from the industry average beta of globally comparable companies, with an imposed limit between 0.8 and 2.0, which is a reasonable range for a stable business.
SWOT Analysis for BlueLinx Holdings
- Debt is not viewed as a risk.
- Earnings declined over the past year.
- Good value based on P/E ratio and estimated fair value.
- Annual earnings are forecast to decline for the next 2 years.
Next Steps:
Although the valuation of a company is important, it shouldn't be the only metric you look at when researching a company. DCF models are not the be-all and end-all of investment valuation. Instead the best use for a DCF model is to test certain assumptions and theories to see if they would lead to the company being undervalued or overvalued. For instance, if the terminal value growth rate is adjusted slightly, it can dramatically alter the overall result. Can we work out why the company is trading at a discount to intrinsic value? For BlueLinx Holdings, we've compiled three further factors you should further examine:
- Risks: For example, we've discovered 2 warning signs for BlueLinx Holdings (1 doesn't sit too well with us!) that you should be aware of before investing here.
- Future Earnings: How does BXC's growth rate compare to its peers and the wider market? Dig deeper into the analyst consensus number for the upcoming years by interacting with our free analyst growth expectation chart.
- Other High Quality Alternatives: Do you like a good all-rounder? Explore our interactive list of high quality stocks to get an idea of what else is out there you may be missing!
PS. The Simply Wall St app conducts a discounted cash flow valuation for every stock on the NYSE every day. If you want to find the calculation for other stocks just search here.
Valuation is complex, but we're here to simplify it.
Discover if BlueLinx Holdings might be undervalued or overvalued with our detailed analysis, featuring fair value estimates, potential risks, dividends, insider trades, and its financial condition.
Access Free AnalysisHave feedback on this article? Concerned about the content? Get in touch with us directly. Alternatively, email editorial-team (at) simplywallst.com.
This article by Simply Wall St is general in nature. We provide commentary based on historical data and analyst forecasts only using an unbiased methodology and our articles are not intended to be financial advice. It does not constitute a recommendation to buy or sell any stock, and does not take account of your objectives, or your financial situation. We aim to bring you long-term focused analysis driven by fundamental data. Note that our analysis may not factor in the latest price-sensitive company announcements or qualitative material. Simply Wall St has no position in any stocks mentioned.
About NYSE:BXC
BlueLinx Holdings
Engages in the distribution of residential and commercial building products in the United States.
Flawless balance sheet and fair value.
Similar Companies
Market Insights

Community Narratives

