
Advertisement
- United States
- /
- Trade Distributors
- /
- NYSE:BCC
Estimating The Intrinsic Value Of Boise Cascade Company (NYSE:BCC)
Key Insights
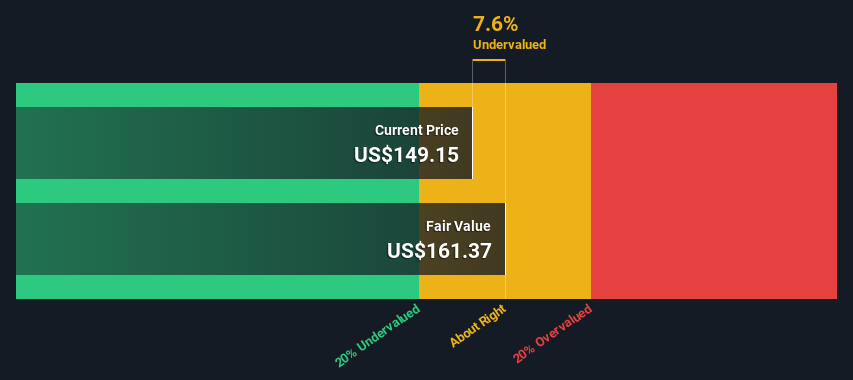
- Using the 2 Stage Free Cash Flow to Equity, Boise Cascade fair value estimate is US$161
- Current share price of US$149 suggests Boise Cascade is potentially trading close to its fair value
- The US$148 analyst price target for BCC is 8.4% less than our estimate of fair value
In this article we are going to estimate the intrinsic value of Boise Cascade Company (NYSE:BCC) by projecting its future cash flows and then discounting them to today's value. The Discounted Cash Flow (DCF) model is the tool we will apply to do this. Believe it or not, it's not too difficult to follow, as you'll see from our example!
Companies can be valued in a lot of ways, so we would point out that a DCF is not perfect for every situation. If you still have some burning questions about this type of valuation, take a look at the Simply Wall St analysis model.
Check out our latest analysis for Boise Cascade
Crunching The Numbers
We are going to use a two-stage DCF model, which, as the name states, takes into account two stages of growth. The first stage is generally a higher growth period which levels off heading towards the terminal value, captured in the second 'steady growth' period. To start off with, we need to estimate the next ten years of cash flows. Where possible we use analyst estimates, but when these aren't available we extrapolate the previous free cash flow (FCF) from the last estimate or reported value. We assume companies with shrinking free cash flow will slow their rate of shrinkage, and that companies with growing free cash flow will see their growth rate slow, over this period. We do this to reflect that growth tends to slow more in the early years than it does in later years.
A DCF is all about the idea that a dollar in the future is less valuable than a dollar today, so we need to discount the sum of these future cash flows to arrive at a present value estimate:
10-year free cash flow (FCF) estimate
| 2024 | 2025 | 2026 | 2027 | 2028 | 2029 | 2030 | 2031 | 2032 | 2033 | |
| Levered FCF ($, Millions) | US$336.7m | US$363.2m | US$359.6m | US$359.7m | US$362.3m | US$366.6m | US$372.2m | US$378.7m | US$386.0m | US$393.8m |
| Growth Rate Estimate Source | Analyst x4 | Analyst x5 | Analyst x2 | Est @ 0.04% | Est @ 0.72% | Est @ 1.19% | Est @ 1.52% | Est @ 1.75% | Est @ 1.91% | Est @ 2.03% |
| Present Value ($, Millions) Discounted @ 7.4% | US$313 | US$315 | US$290 | US$270 | US$254 | US$239 | US$226 | US$214 | US$203 | US$193 |
("Est" = FCF growth rate estimated by Simply Wall St)
Present Value of 10-year Cash Flow (PVCF) = US$2.5b
The second stage is also known as Terminal Value, this is the business's cash flow after the first stage. The Gordon Growth formula is used to calculate Terminal Value at a future annual growth rate equal to the 5-year average of the 10-year government bond yield of 2.3%. We discount the terminal cash flows to today's value at a cost of equity of 7.4%.
Terminal Value (TV)= FCF2033 × (1 + g) ÷ (r – g) = US$394m× (1 + 2.3%) ÷ (7.4%– 2.3%) = US$7.9b
Present Value of Terminal Value (PVTV)= TV / (1 + r)10= US$7.9b÷ ( 1 + 7.4%)10= US$3.9b
The total value, or equity value, is then the sum of the present value of the future cash flows, which in this case is US$6.4b. To get the intrinsic value per share, we divide this by the total number of shares outstanding. Relative to the current share price of US$149, the company appears about fair value at a 7.6% discount to where the stock price trades currently. The assumptions in any calculation have a big impact on the valuation, so it is better to view this as a rough estimate, not precise down to the last cent.
The Assumptions
The calculation above is very dependent on two assumptions. The first is the discount rate and the other is the cash flows. If you don't agree with these result, have a go at the calculation yourself and play with the assumptions. The DCF also does not consider the possible cyclicality of an industry, or a company's future capital requirements, so it does not give a full picture of a company's potential performance. Given that we are looking at Boise Cascade as potential shareholders, the cost of equity is used as the discount rate, rather than the cost of capital (or weighted average cost of capital, WACC) which accounts for debt. In this calculation we've used 7.4%, which is based on a levered beta of 1.110. Beta is a measure of a stock's volatility, compared to the market as a whole. We get our beta from the industry average beta of globally comparable companies, with an imposed limit between 0.8 and 2.0, which is a reasonable range for a stable business.
SWOT Analysis for Boise Cascade
Strength
- Debt is not viewed as a risk.
- Dividends are covered by earnings and cash flows.
- Dividend is in the top 25% of dividend payers in the market.
Weakness
- Earnings declined over the past year.
Opportunity
- Good value based on P/E ratio and estimated fair value.
Threat
- Annual earnings are forecast to decline for the next 3 years.
Looking Ahead:
Valuation is only one side of the coin in terms of building your investment thesis, and it ideally won't be the sole piece of analysis you scrutinize for a company. It's not possible to obtain a foolproof valuation with a DCF model. Preferably you'd apply different cases and assumptions and see how they would impact the company's valuation. For instance, if the terminal value growth rate is adjusted slightly, it can dramatically alter the overall result. For Boise Cascade, there are three additional items you should explore:
- Risks: You should be aware of the 4 warning signs for Boise Cascade (1 doesn't sit too well with us!) we've uncovered before considering an investment in the company.
- Management:Have insiders been ramping up their shares to take advantage of the market's sentiment for BCC's future outlook? Check out our management and board analysis with insights on CEO compensation and governance factors.
- Other High Quality Alternatives: Do you like a good all-rounder? Explore our interactive list of high quality stocks to get an idea of what else is out there you may be missing!
PS. The Simply Wall St app conducts a discounted cash flow valuation for every stock on the NYSE every day. If you want to find the calculation for other stocks just search here.
Valuation is complex, but we're here to simplify it.
Discover if Boise Cascade might be undervalued or overvalued with our detailed analysis, featuring fair value estimates, potential risks, dividends, insider trades, and its financial condition.
Access Free AnalysisHave feedback on this article? Concerned about the content? Get in touch with us directly. Alternatively, email editorial-team (at) simplywallst.com.
This article by Simply Wall St is general in nature. We provide commentary based on historical data and analyst forecasts only using an unbiased methodology and our articles are not intended to be financial advice. It does not constitute a recommendation to buy or sell any stock, and does not take account of your objectives, or your financial situation. We aim to bring you long-term focused analysis driven by fundamental data. Note that our analysis may not factor in the latest price-sensitive company announcements or qualitative material. Simply Wall St has no position in any stocks mentioned.
About NYSE:BCC
Boise Cascade
Engages in manufacture and sale of engineered wood products (EWP) and plywood, and wholesale distribution of building materials in the United States and Canada.
Very undervalued with flawless balance sheet.
Similar Companies
Market Insights

Advertisement
Community Narratives
The Next Phase of Energy Storage: How NeoVolta Is Tackling America’s Power Crunch
Fair Value US$7.50|35.1% undervalued
MA
Community Contributor
Why EnSilica is Worth Possibly 13x its Current Price
Fair Value UK£5.00|89.8% undervalued
DO
Community Contributor
M&A Activity, Industry Diversification & A Defense Contract Monopoly Will Push BWXT For Healthy Long-Term Growth
Fair Value US$220.00|15.2% undervalued
CL
Community Contributor
A case for Cassiar Gold Corp (TSXV: GLDC) to reach CAD$8-10 before 2030 (X30-37)
Fair Value CA$10.00|96.0% undervalued
AG
Community Contributor