
Advertisement
Key Insights
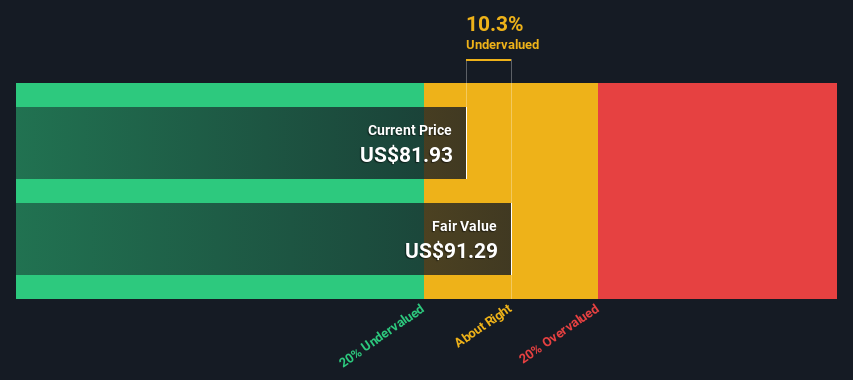
- Using the 2 Stage Free Cash Flow to Equity, AZZ fair value estimate is US$91.29
- With US$81.93 share price, AZZ appears to be trading close to its estimated fair value
- The US$76.33 analyst price target for AZZ is 16% less than our estimate of fair value
In this article we are going to estimate the intrinsic value of AZZ Inc. (NYSE:AZZ) by taking the expected future cash flows and discounting them to today's value. We will use the Discounted Cash Flow (DCF) model on this occasion. It may sound complicated, but actually it is quite simple!
We would caution that there are many ways of valuing a company and, like the DCF, each technique has advantages and disadvantages in certain scenarios. Anyone interested in learning a bit more about intrinsic value should have a read of the Simply Wall St analysis model.
Check out our latest analysis for AZZ
The Model
We are going to use a two-stage DCF model, which, as the name states, takes into account two stages of growth. The first stage is generally a higher growth period which levels off heading towards the terminal value, captured in the second 'steady growth' period. In the first stage we need to estimate the cash flows to the business over the next ten years. Where possible we use analyst estimates, but when these aren't available we extrapolate the previous free cash flow (FCF) from the last estimate or reported value. We assume companies with shrinking free cash flow will slow their rate of shrinkage, and that companies with growing free cash flow will see their growth rate slow, over this period. We do this to reflect that growth tends to slow more in the early years than it does in later years.
Generally we assume that a dollar today is more valuable than a dollar in the future, so we need to discount the sum of these future cash flows to arrive at a present value estimate:
10-year free cash flow (FCF) forecast
| 2024 | 2025 | 2026 | 2027 | 2028 | 2029 | 2030 | 2031 | 2032 | 2033 | |
| Levered FCF ($, Millions) | US$140.9m | US$107.5m | US$134.6m | US$147.5m | US$158.4m | US$167.7m | US$175.7m | US$182.9m | US$189.3m | US$195.2m |
| Growth Rate Estimate Source | Analyst x2 | Analyst x2 | Analyst x1 | Est @ 9.59% | Est @ 7.40% | Est @ 5.87% | Est @ 4.80% | Est @ 4.04% | Est @ 3.52% | Est @ 3.15% |
| Present Value ($, Millions) Discounted @ 8.9% | US$129 | US$90.7 | US$104 | US$105 | US$104 | US$101 | US$96.9 | US$92.6 | US$88.0 | US$83.4 |
("Est" = FCF growth rate estimated by Simply Wall St)
Present Value of 10-year Cash Flow (PVCF) = US$994m
We now need to calculate the Terminal Value, which accounts for all the future cash flows after this ten year period. The Gordon Growth formula is used to calculate Terminal Value at a future annual growth rate equal to the 5-year average of the 10-year government bond yield of 2.3%. We discount the terminal cash flows to today's value at a cost of equity of 8.9%.
Terminal Value (TV)= FCF2033 × (1 + g) ÷ (r – g) = US$195m× (1 + 2.3%) ÷ (8.9%– 2.3%) = US$3.0b
Present Value of Terminal Value (PVTV)= TV / (1 + r)10= US$3.0b÷ ( 1 + 8.9%)10= US$1.3b
The total value is the sum of cash flows for the next ten years plus the discounted terminal value, which results in the Total Equity Value, which in this case is US$2.3b. In the final step we divide the equity value by the number of shares outstanding. Compared to the current share price of US$81.9, the company appears about fair value at a 10% discount to where the stock price trades currently. Remember though, that this is just an approximate valuation, and like any complex formula - garbage in, garbage out.
The Assumptions
The calculation above is very dependent on two assumptions. The first is the discount rate and the other is the cash flows. You don't have to agree with these inputs, I recommend redoing the calculations yourself and playing with them. The DCF also does not consider the possible cyclicality of an industry, or a company's future capital requirements, so it does not give a full picture of a company's potential performance. Given that we are looking at AZZ as potential shareholders, the cost of equity is used as the discount rate, rather than the cost of capital (or weighted average cost of capital, WACC) which accounts for debt. In this calculation we've used 8.9%, which is based on a levered beta of 1.432. Beta is a measure of a stock's volatility, compared to the market as a whole. We get our beta from the industry average beta of globally comparable companies, with an imposed limit between 0.8 and 2.0, which is a reasonable range for a stable business.
SWOT Analysis for AZZ
Strength
- Earnings growth over the past year exceeded the industry.
- Dividends are covered by earnings and cash flows.
Weakness
- Interest payments on debt are not well covered.
- Dividend is low compared to the top 25% of dividend payers in the Building market.
Opportunity
- Annual earnings are forecast to grow faster than the American market.
- Current share price is below our estimate of fair value.
Threat
- Debt is not well covered by operating cash flow.
- Annual revenue is forecast to grow slower than the American market.
Moving On:
Although the valuation of a company is important, it is only one of many factors that you need to assess for a company. It's not possible to obtain a foolproof valuation with a DCF model. Rather it should be seen as a guide to "what assumptions need to be true for this stock to be under/overvalued?" For example, changes in the company's cost of equity or the risk free rate can significantly impact the valuation. For AZZ, we've compiled three additional factors you should assess:
- Risks: For example, we've discovered 1 warning sign for AZZ that you should be aware of before investing here.
- Future Earnings: How does AZZ's growth rate compare to its peers and the wider market? Dig deeper into the analyst consensus number for the upcoming years by interacting with our free analyst growth expectation chart.
- Other Solid Businesses: Low debt, high returns on equity and good past performance are fundamental to a strong business. Why not explore our interactive list of stocks with solid business fundamentals to see if there are other companies you may not have considered!
PS. Simply Wall St updates its DCF calculation for every American stock every day, so if you want to find the intrinsic value of any other stock just search here.
New: Manage All Your Stock Portfolios in One Place
We've created the ultimate portfolio companion for stock investors, and it's free.
• Connect an unlimited number of Portfolios and see your total in one currency
• Be alerted to new Warning Signs or Risks via email or mobile
• Track the Fair Value of your stocks
Have feedback on this article? Concerned about the content? Get in touch with us directly. Alternatively, email editorial-team (at) simplywallst.com.
This article by Simply Wall St is general in nature. We provide commentary based on historical data and analyst forecasts only using an unbiased methodology and our articles are not intended to be financial advice. It does not constitute a recommendation to buy or sell any stock, and does not take account of your objectives, or your financial situation. We aim to bring you long-term focused analysis driven by fundamental data. Note that our analysis may not factor in the latest price-sensitive company announcements or qualitative material. Simply Wall St has no position in any stocks mentioned.
About NYSE:AZZ
AZZ
Operates as a hot-dip galvanizing and coil coating solutions provider in North America.
Moderate growth potential low.
Similar Companies
Market Insights

Advertisement
Community Narratives
Groundbreaking therapies that could change the treatment landscape for PTSD, fibromyalgia, MS & Alzheimer’s
Fair Value US$6.20|86.9% undervalued
CM
Community Contributor
DigitalOcean Will Grow 14% by Embracing AI with Paperspace Acquisition
Fair Value US$50.00|42.8% undervalued
NE
Community Contributor
Viant Technology: A Rising AdTech Challenger in the AI-Powered CTV Market
Fair Value US$38.61|66.0% undervalued
BL
Community Contributor
Volvo will Accelerate Forward into Electric and Autonomous Leadership in Five Years
Fair Value SEK 438.80|40.8% undervalued
UN
Community Contributor